 aws-analyzer · lambda_functions.py
See every Lambda function from a SageMaker notebook
Install it in your notebook and see your Lambda functions, in one region or every one your account uses: what each one runs and when its runtime loses support, what triggers it and who else can call it, how often it ran, failed and was throttled, what it costs, and why it fails, read from its own logs, without leaving Jupyter. Or open the explorer window and see it all by clicking, its logs run by run.
- One install, boto3 only
- Read-only: never invokes or changes a function
- Every region at once
- An explorer window: click, don't type
- Plain text outside Jupyter
Every example uses acme's functions: orders-etl, which loads each day's orders from S3 into the warehouse, churn-scoring, which scores customers with a model trained in SageMaker, and report-api, which serves a sales report over a function URL. Use your own names. The screenshots are real output from the tool, run against moto with synthetic data.
Set up in SageMaker
-
Install the package, in a notebook cell:
%pip install aws-analyzerNo internet in the notebook (VPC-only mode)? On a computer that has internet, download the package and copy it to a bucket the notebook can read (
pip download aws-analyzer --no-deps -d wheels, thenaws s3 cp --recursive wheels/ s3://acme-ml-data/tools/wheels/), and install it from there:!aws s3 cp --recursive s3://acme-ml-data/tools/wheels/ wheels/ %pip install --no-index --find-links wheels aws-analyzer -
Import it and create the view. It uses the notebook's IAM execution role and region, so there's nothing to configure.
from aws_analyzer import LambdaView ui = LambdaView() # uses the notebook's IAM role and region ui.help() # every command, grouped by task; ui.help("errors") shows one in full -
Optional: another region or AWS profile, or plain-text output.
from aws_analyzer import LambdaAnalyzer, LambdaView

ui = LambdaView(LambdaAnalyzer(region="eu-west-1", profile="dev"))
ui = LambdaView(mode="text")    # plain text, e.g. in a terminal or a script
Only boto3 is required. The module isn't called lambda because that's a Python keyword: from aws_analyzer import lambda can't work, so it's aws_analyzer.lambda_functions.
Nothing is invoked, changed or deleted. Where a change would help, the report shows the AWS CLI command to run instead. Environment variable values never appear in a report: only their names do, because the values often hold passwords and keys.
Five-minute tour
The commands you'll use most. Each one prints a report under the cell; none of them change anything.
ui.functions()                              # every function in the region: runtime, triggers, calls, errors, cost
ui.functions(regions="all")                 # ...in every region your account has turned on
ui.function_info("orders-etl")              # one function in plain English, and its last 30 days
ui.errors("orders-etl")                     # its errors in the last 24 hours, grouped by cause
ui.logs("orders-etl", search="KeyError")    # the newest lines it logged
ui.performance("orders-etl")                # run times, memory used and cold starts, and the memory it needs
ui.code("orders-etl")                       # the files in its package, and the handler's source
ui.explore()                                # all of it in a window, by clicking: functions, logs run by run
Reading a report. Every report puts the answer first: cards with the numbers that matter (a card turns amber or red when a finding is about it), then the findings, warnings first, each ending in what to do. The tables of detail come after, and at the bottom a Next row of two or three commands with the arguments filled in from this report, such as errors('orders-etl'). One click on a command anywhere in a report, or on a code block, selects all of it, ready to copy.
Naming a function. Commands that work on one function take its name, "name:alias" or "name:version", its ARN, or a link to it in the Lambda console, so you can paste what you have. Functions are regional: pass region="eu-west-1" for one outside the view's region (an ARN or a link already says where it is), and after functions(regions="all"), a name found in only one other region is looked for there.
The explorer window
Rather click than type? explore() opens a window on your functions that you use by clicking, with nothing to type but a search. Every function in the region is listed with how it's doing. Click one to see what's wrong with it, what calls it and where its results go, and, a click away, its logs run by run, its errors grouped by cause, its run times, the code in its package and every setting. Like the commands, it only reads: where a change would help, it shows the command to run.
from aws_analyzer.lambda_functions import explore

explore()                                # every function in the notebook's region
explore("orders-etl")                    # straight to one function: a name, an ARN or a console link
explore("orders-etl", tab="logs")        # ...on its logs (or "errors", "performance", "code", "settings")
explore(region="all")                    # every region your account has turned on
explore(region="eu-west-1", profile="dev")   # another region or AWS profile
explore(height=800)                      # 800px pages (else the browser's height)
ui.explore("orders-etl")                 # from a LambdaView
The window needs ipywidgets, which SageMaker notebooks already have (elsewhere, %pip install ipywidgets, then reload the browser tab). Without it, or outside Jupyter, explore() shows the same as reports: functions(), or for one function function_info() or the report of the tab you asked for.
The top of the window is the region field, the function field and their cards. The region field switches to another region, or to every region at once. Click the function field for every function, with a search box that finds one by its name, description, runtime or region; Enter picks the first, and a function's ARN or console link works too, even one in another region. With no function picked, the cards sum up the region: its functions, their calls and error rate over 30 days, the estimated monthly cost, and how many need attention. With one picked, they're its own. The line at the bottom of the window says what's going on.
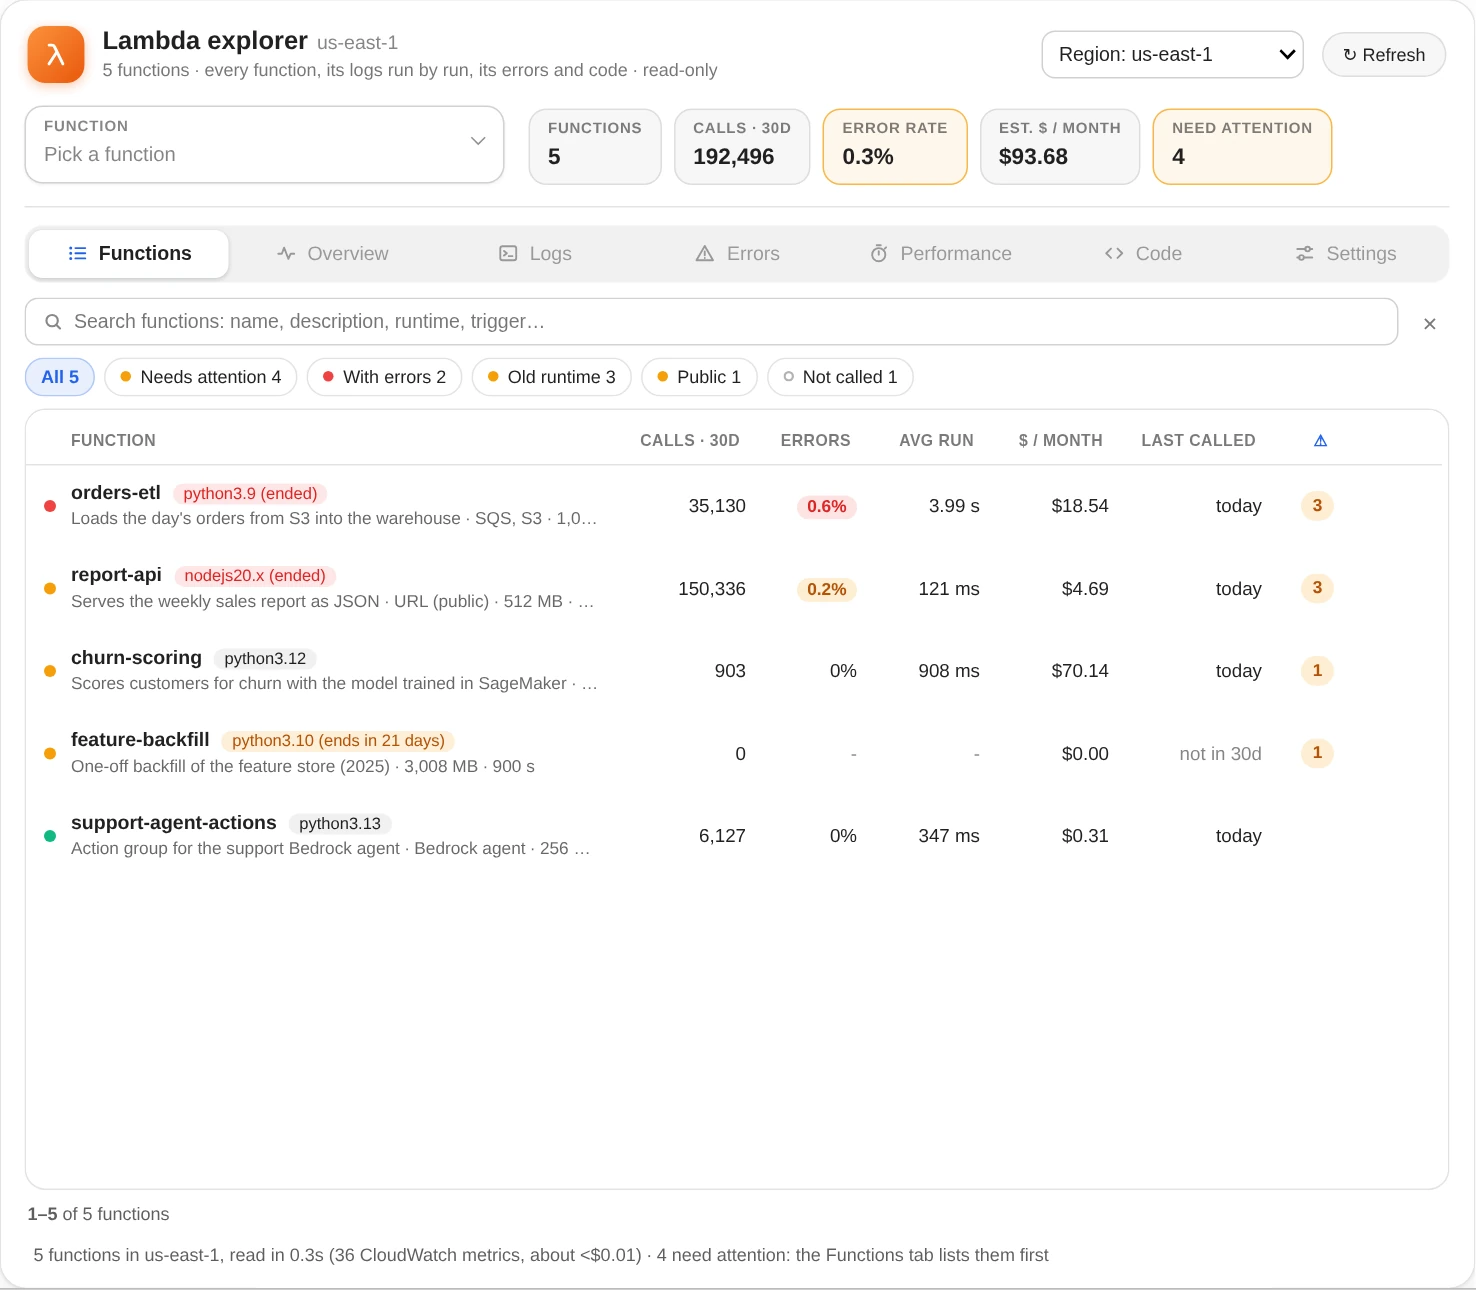
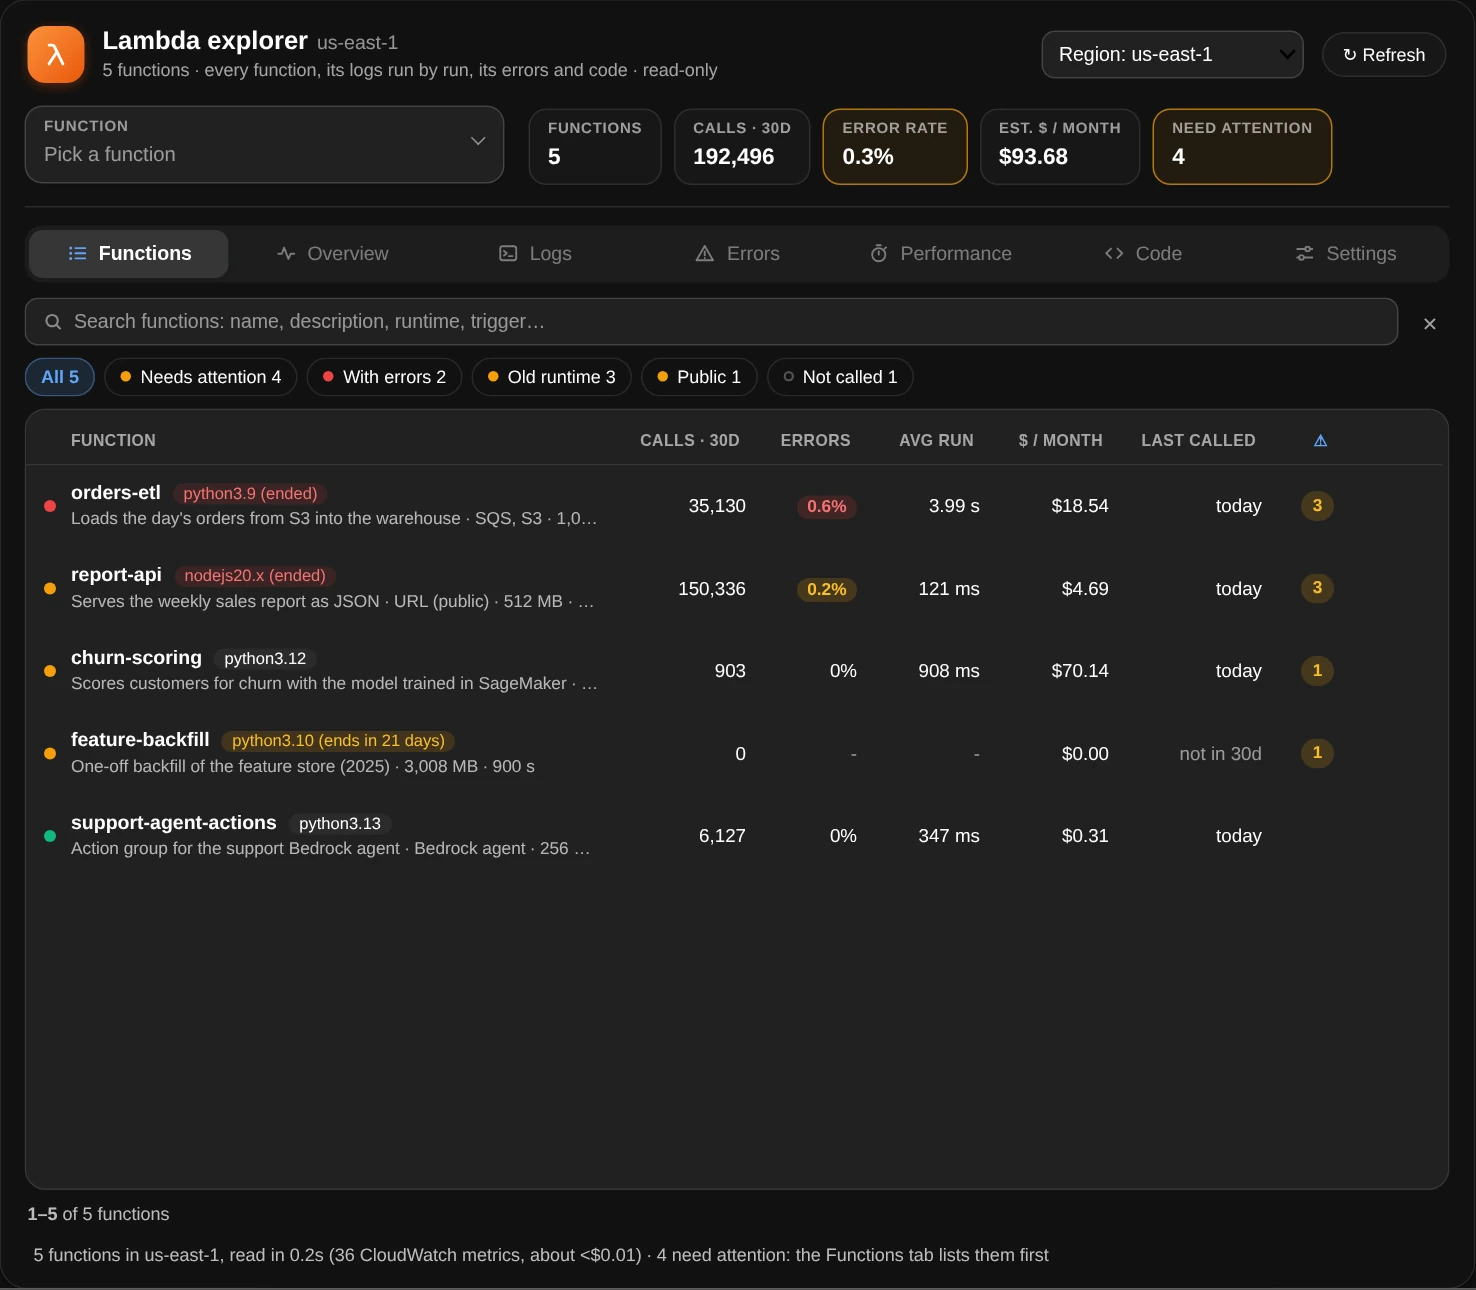
Functions: every function with its runtime, calls, error rate, run time, cost and warnings, the ones that need attention first.
Every function
The Functions tab lists every function with what CloudWatch counted for it over the last 30 days: its runtime (marked once AWS stops patching it, or when that's close), what triggers it, its calls, error rate, average run time, estimated monthly cost, when it was last called, and how many warnings it has. The ones that need attention come first, and a dot says how each is doing: red when its calls fail often enough to act on, amber when it has a warning, green when all is well, hollow when nothing called it in 30 days.
Type in the search box to find a function by part of its name, its description, runtime, region or trigger (sqs). Click a chip to see only the functions that need attention, have errors, run an old runtime, are public or weren't called (click it again for all of them), and click a column's header to sort by it (again for the other way). Click a function to open it, or Logs on its line, which shows when you point at it, to go straight to its logs. The list shows at once, and fills in as CloudWatch answers with the calls and errors, then with the triggers each function's resource policy allows.
Logs, run by run
The Logs tab is what CloudWatch would show you, grouped the way you think about it: by run. Each line is one call, newest first: when it started (in UTC), whether it ran (✓), failed (✕), timed out (⏱) or only logged an error (!), how long it ran against the timeout, the memory it used, a cold start, and what made it fail or the first thing it logged. Click a run to see every line it logged, with how far into the run each came and its level. Lambda's START and END lines are folded into the run, and its REPORT line becomes the summary under the lines, with the request ID to copy.
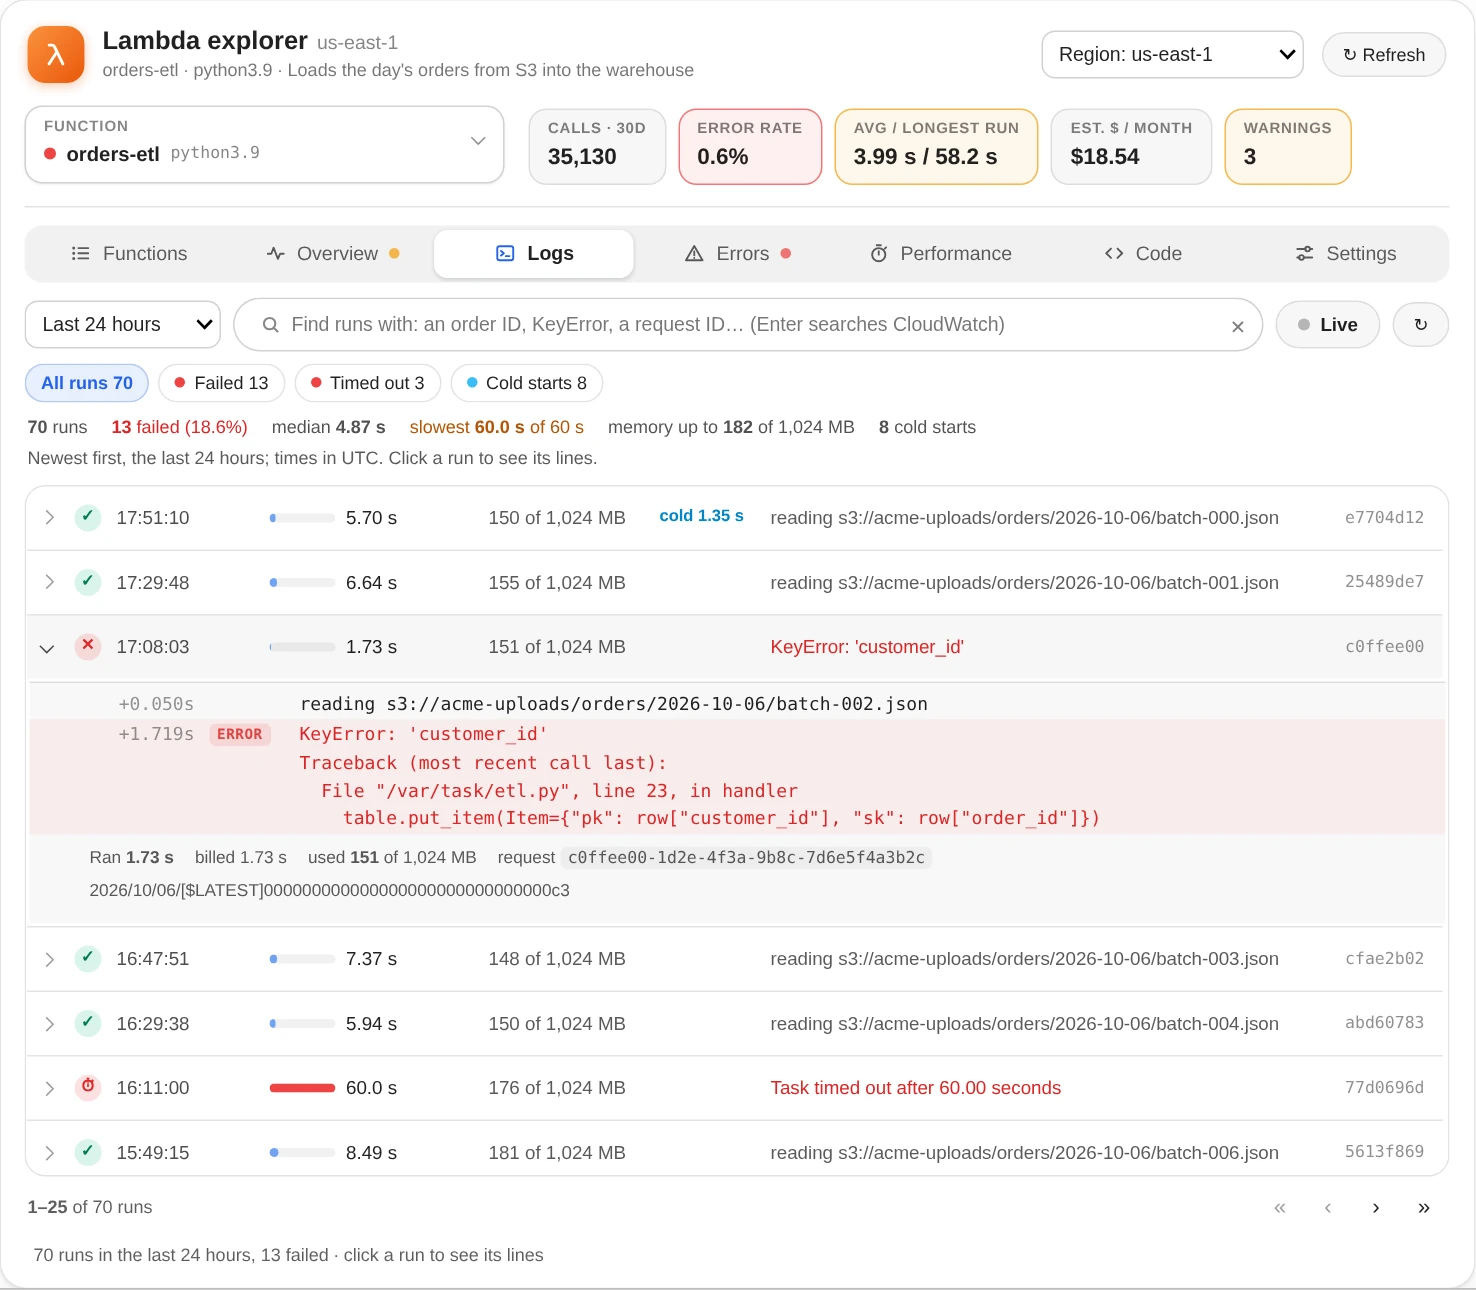
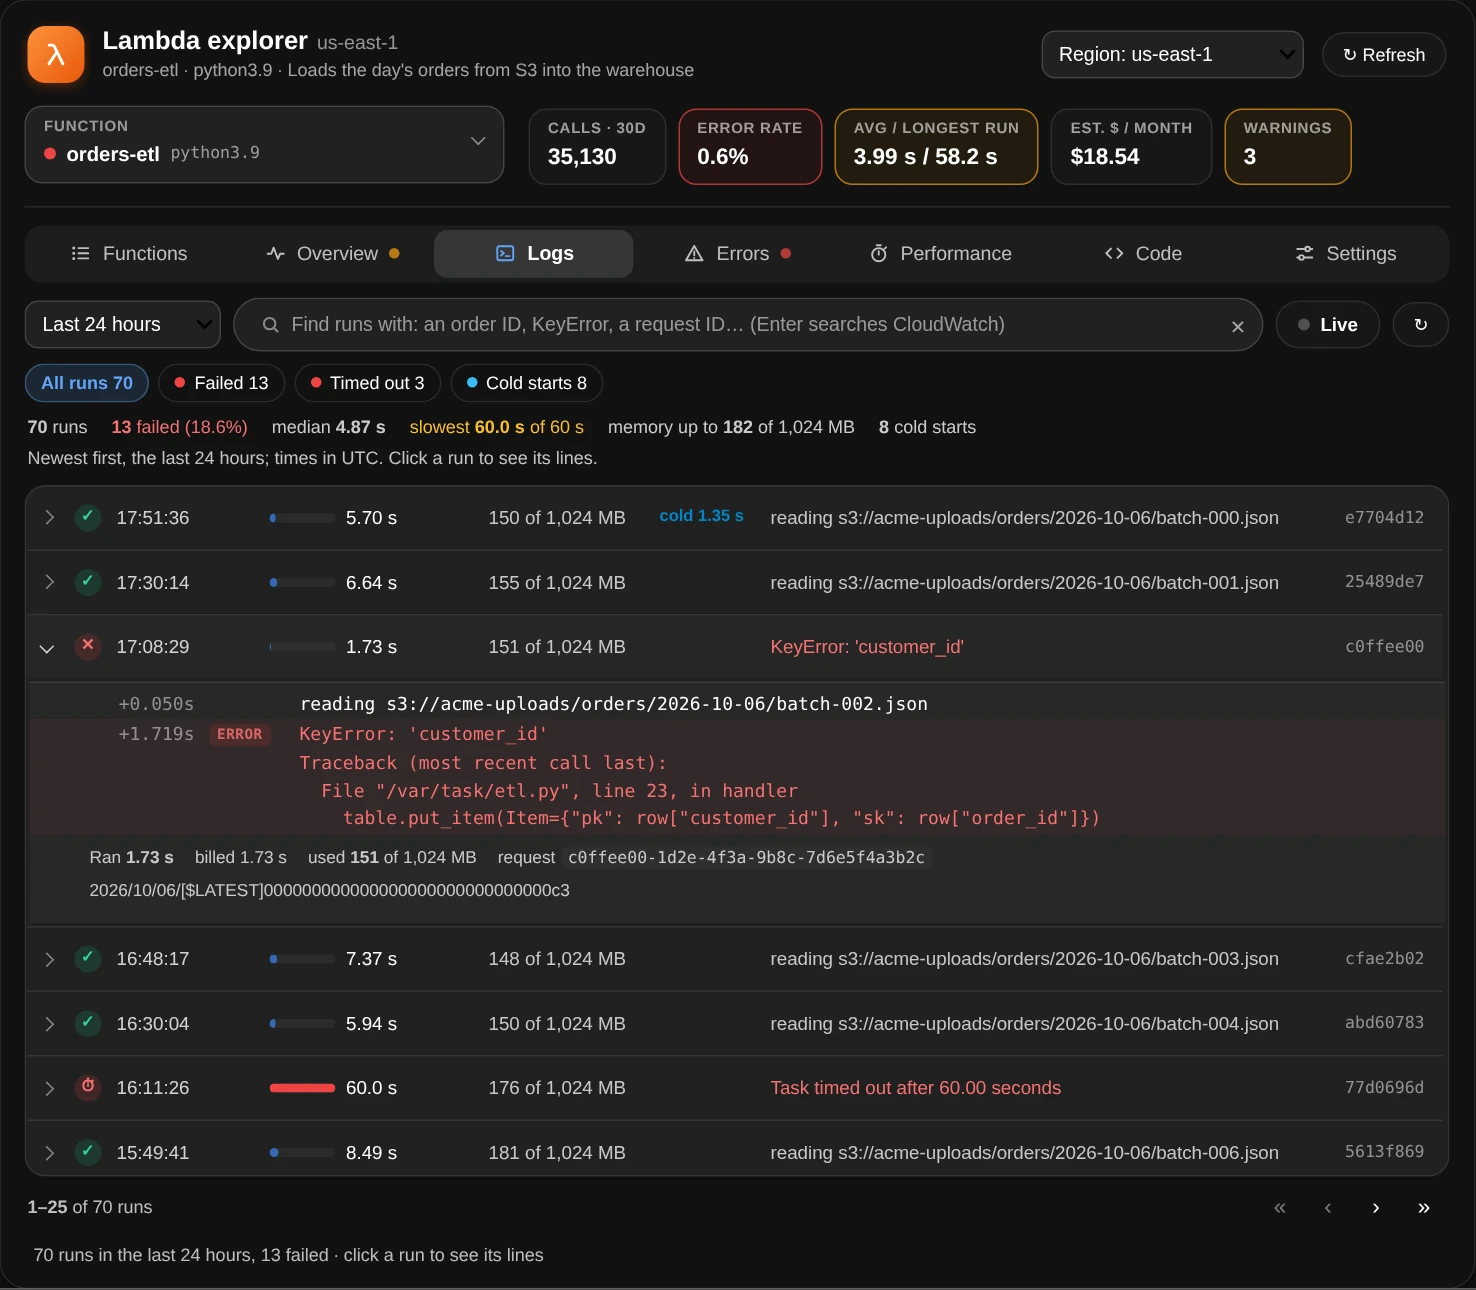
Logs: orders-etl's last 24 hours, run by run, with a failed run open: its traceback, and its REPORT line summed up.
Above the runs:
- The time range, from the last 15 minutes to the last 30 days (the last hour at first). The newest 3,000 lines are read; when the range holds more, Older runs under the list reads further back. A range with nothing in it says when the function last logged, and a button picks a range that reaches it.
- The search box finds runs as you type: an order ID,
KeyError, a request ID, in any case, among the runs read. Enter asks CloudWatch to search the whole time range, and brings back each run with a matching line whole, the matching lines marked. A CloudWatch Logs filter pattern (?ERROR ?WARN,{ $.level = "ERROR" }) works too, with Enter. ✕ shows every run again. - The chips show only the runs that failed, timed out, logged an error (and may have handled it) or were cold starts.
- Live looks for new lines every 5 seconds and puts the new runs at the top, to watch a function while you test it. It stops when you leave the tab, and after 15 minutes.
The line over the runs sums up the ones shown: how many, how many failed, the median and slowest run time against the timeout, the most memory used, and the cold starts.
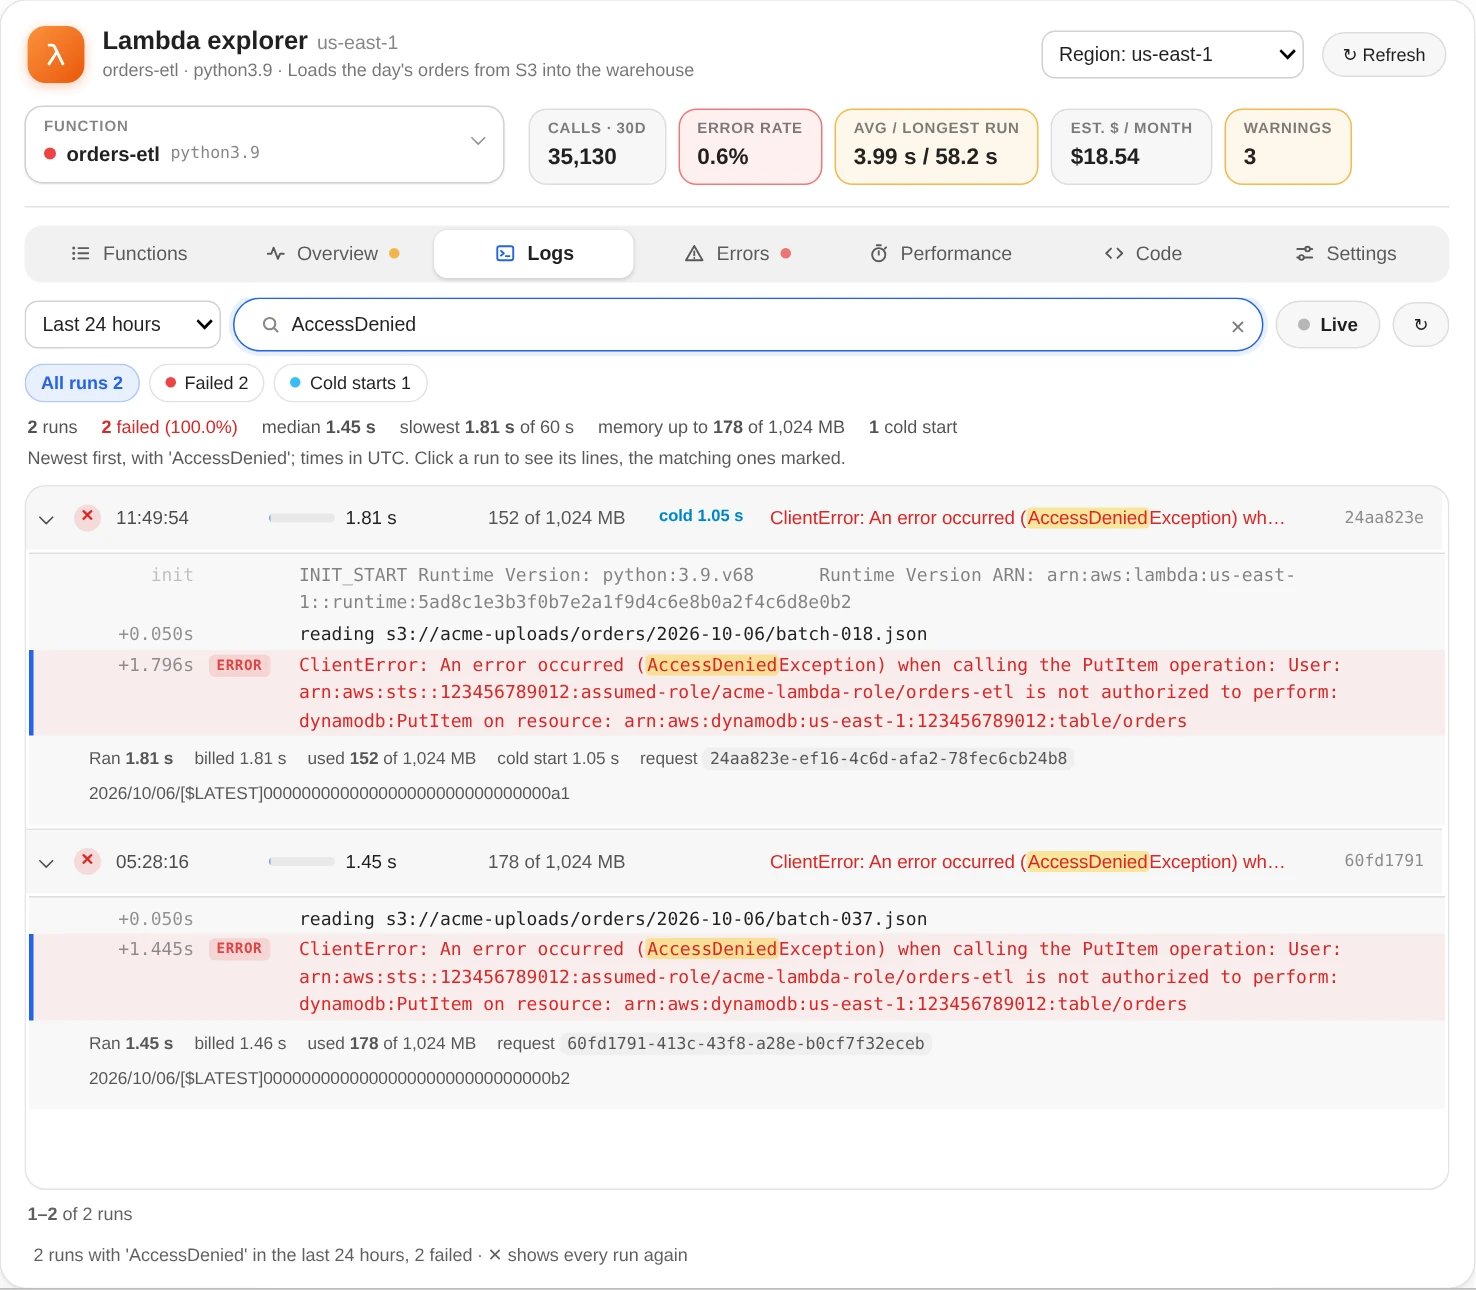
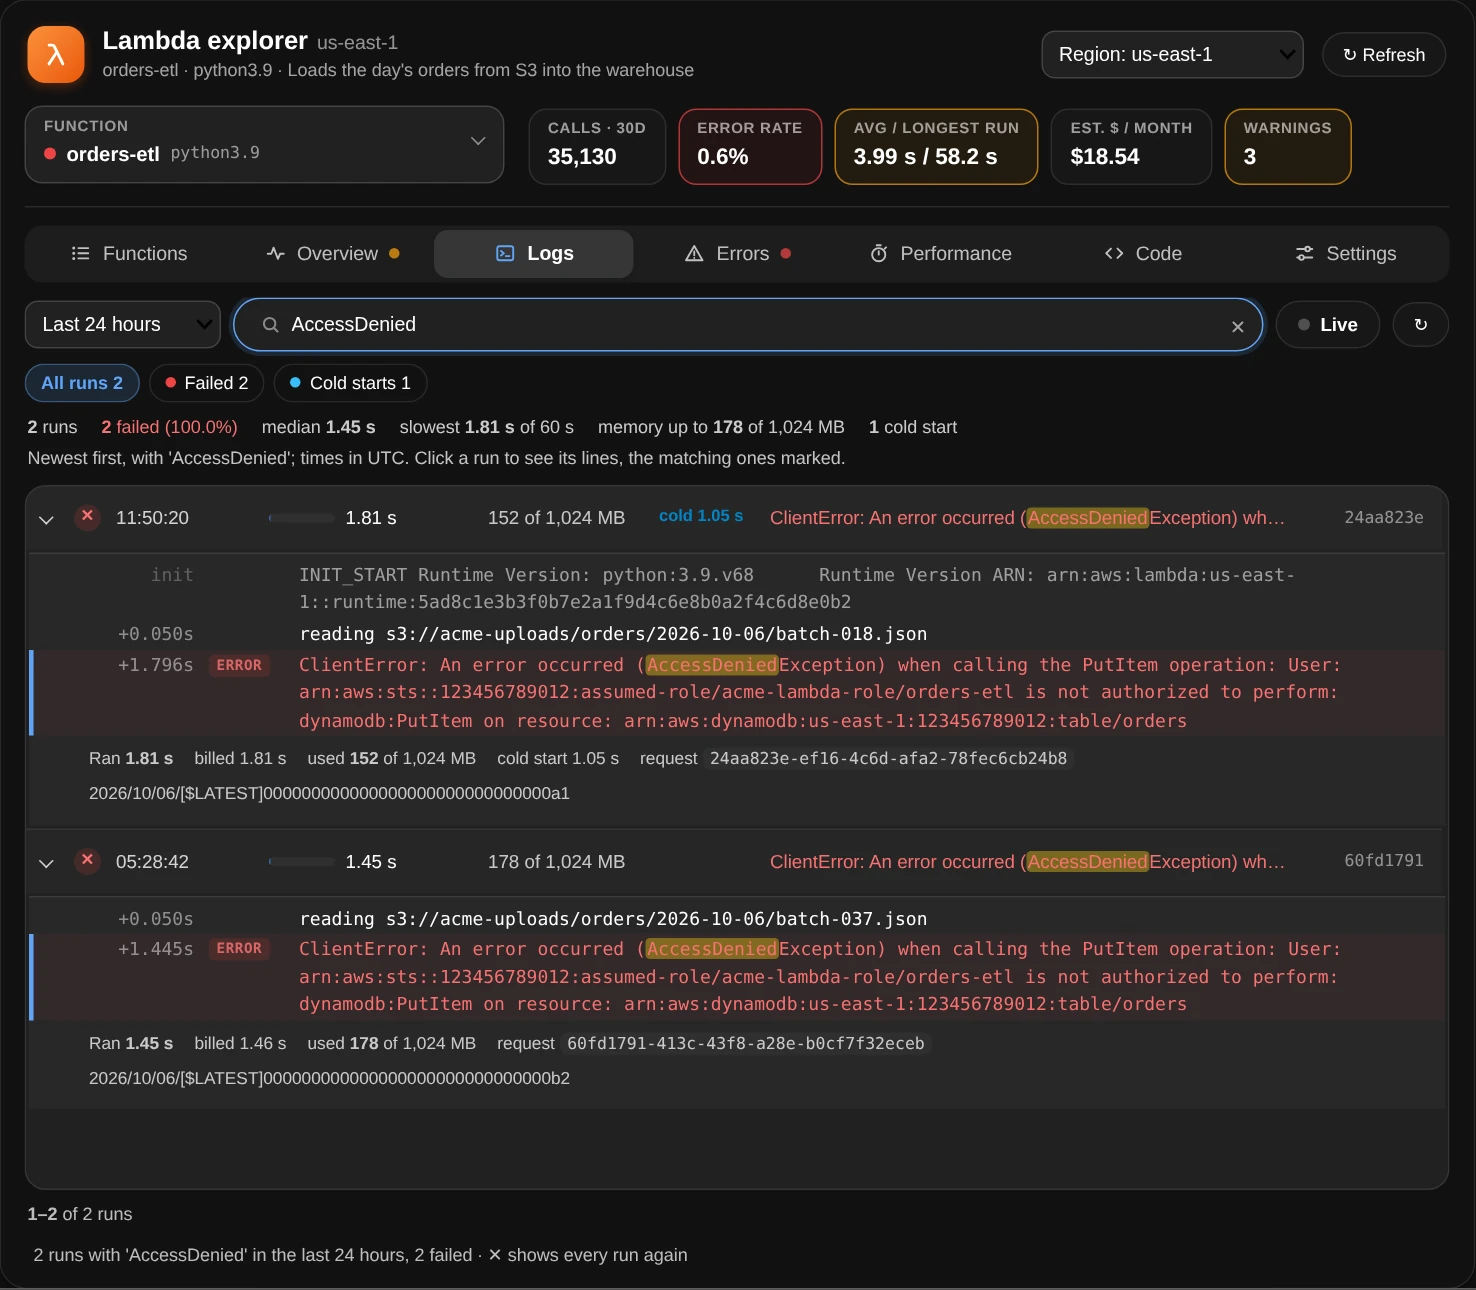
AccessDenied, searched in CloudWatch: two runs in the last 24 hours, each brought back whole, the matching line marked.
Logs in JSON (a function whose log format is JSON) show each line's message, with its other fields a click away. An error the runtime logged in JSON reads like a traceback: its type, its message, then its stack.
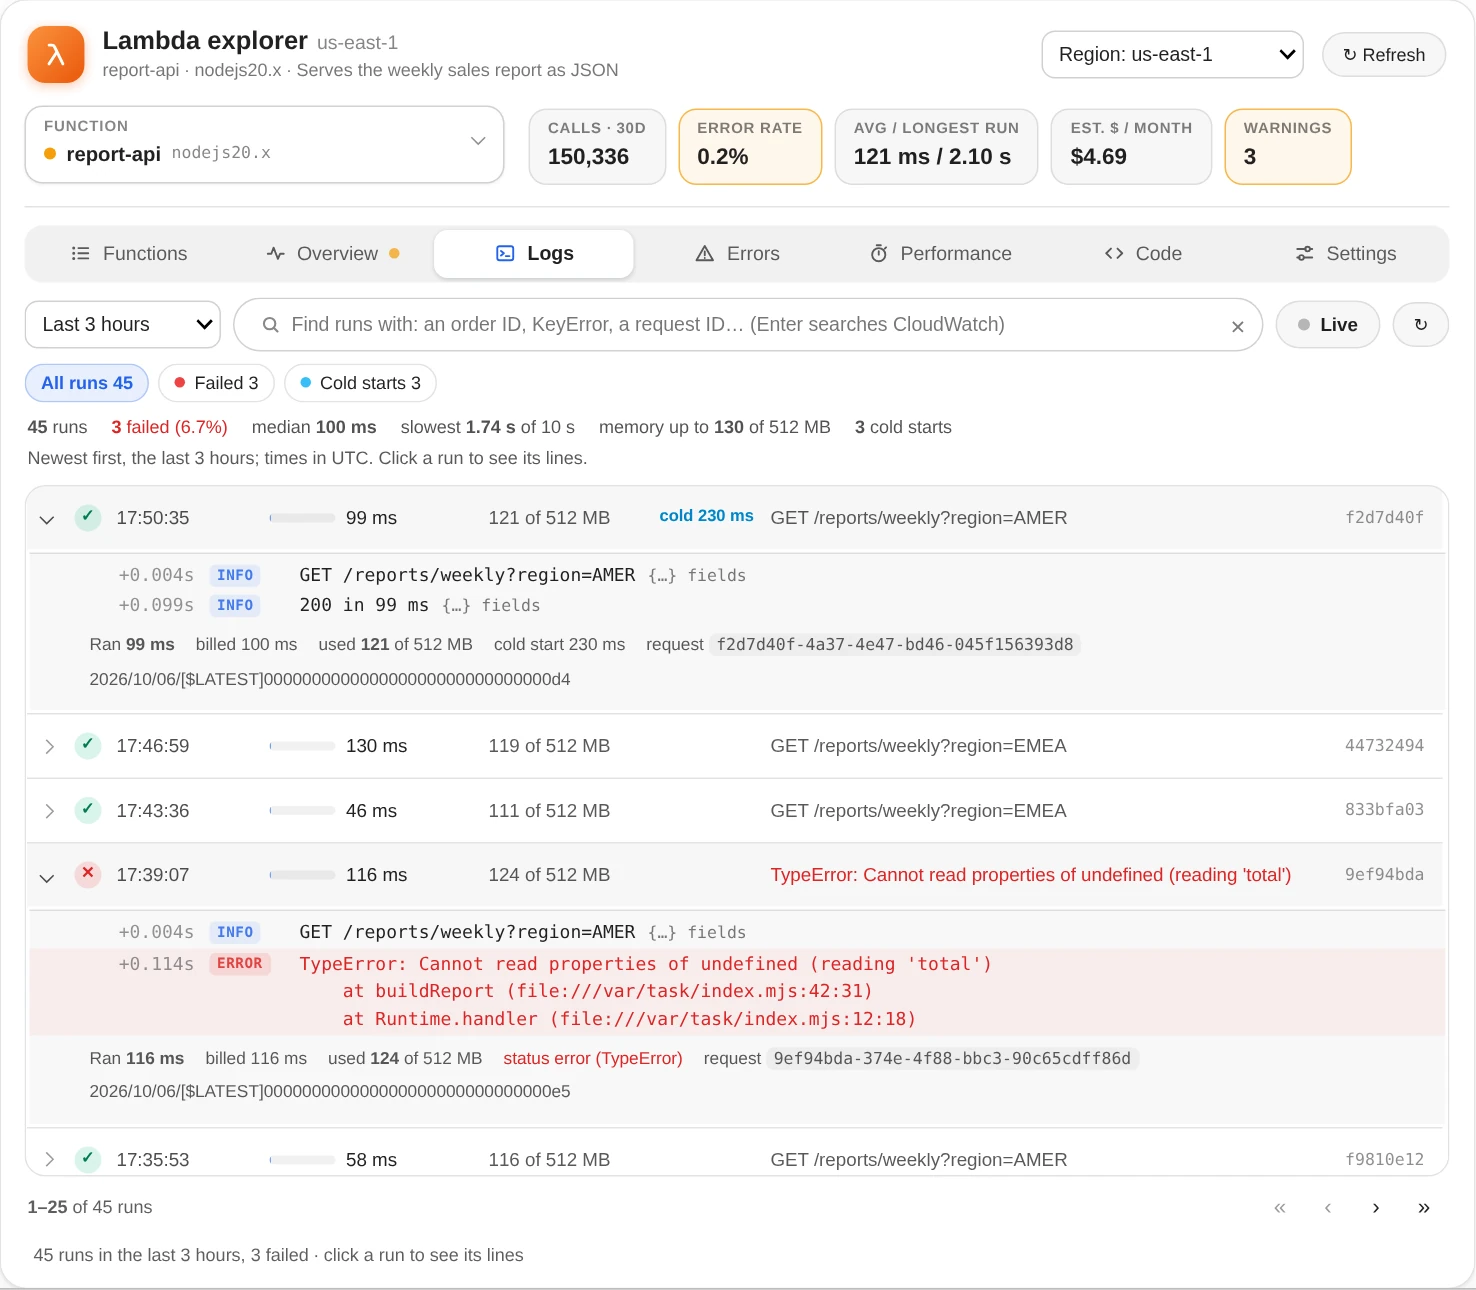
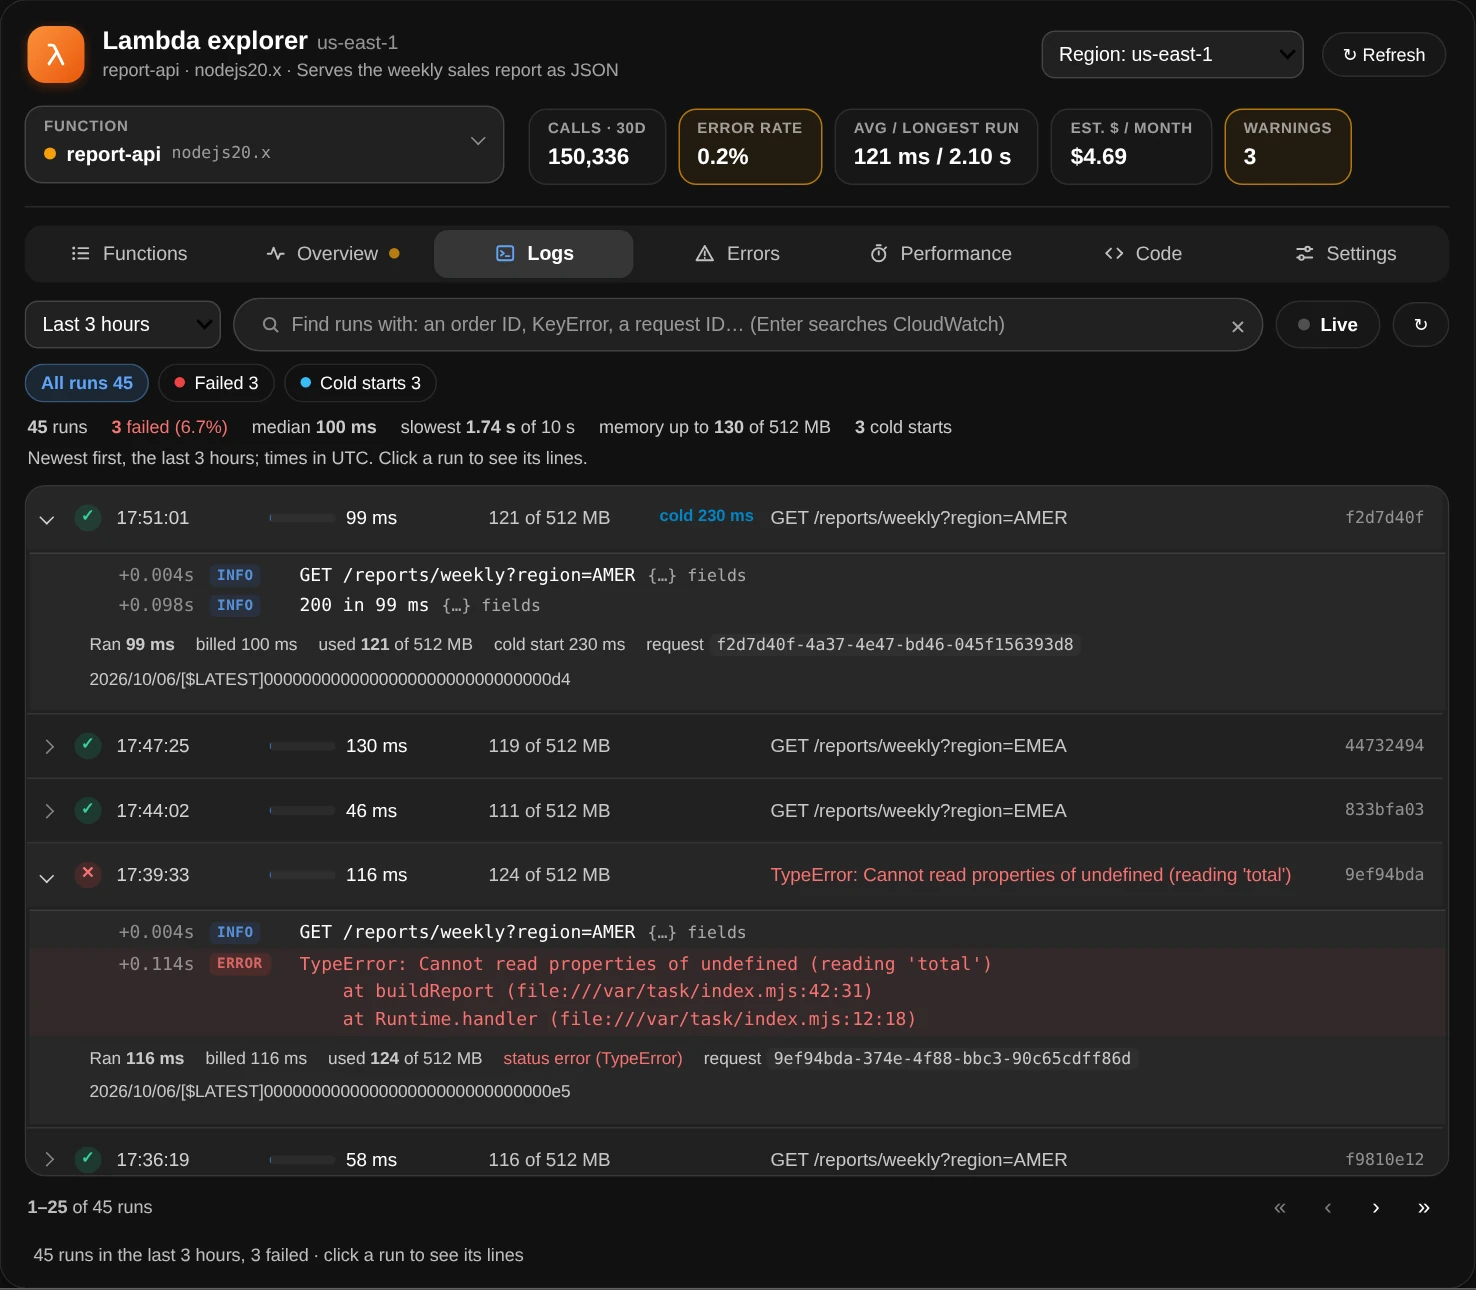
report-api logs JSON: each line's message, its level, and its other fields a click away.
How it's doing
The Overview tab has function_info()'s findings, each with what to do. Under them, how it's wired: what calls the function (the queues and streams Lambda reads for it, the services and accounts its resource policy allows, its function URL), the function, and where its results, failed events and logs go, a failure destination it doesn't have in amber. Then its calls a day over 30 days, the failed part in red, its run time a day against the timeout, and what it costs, by part.
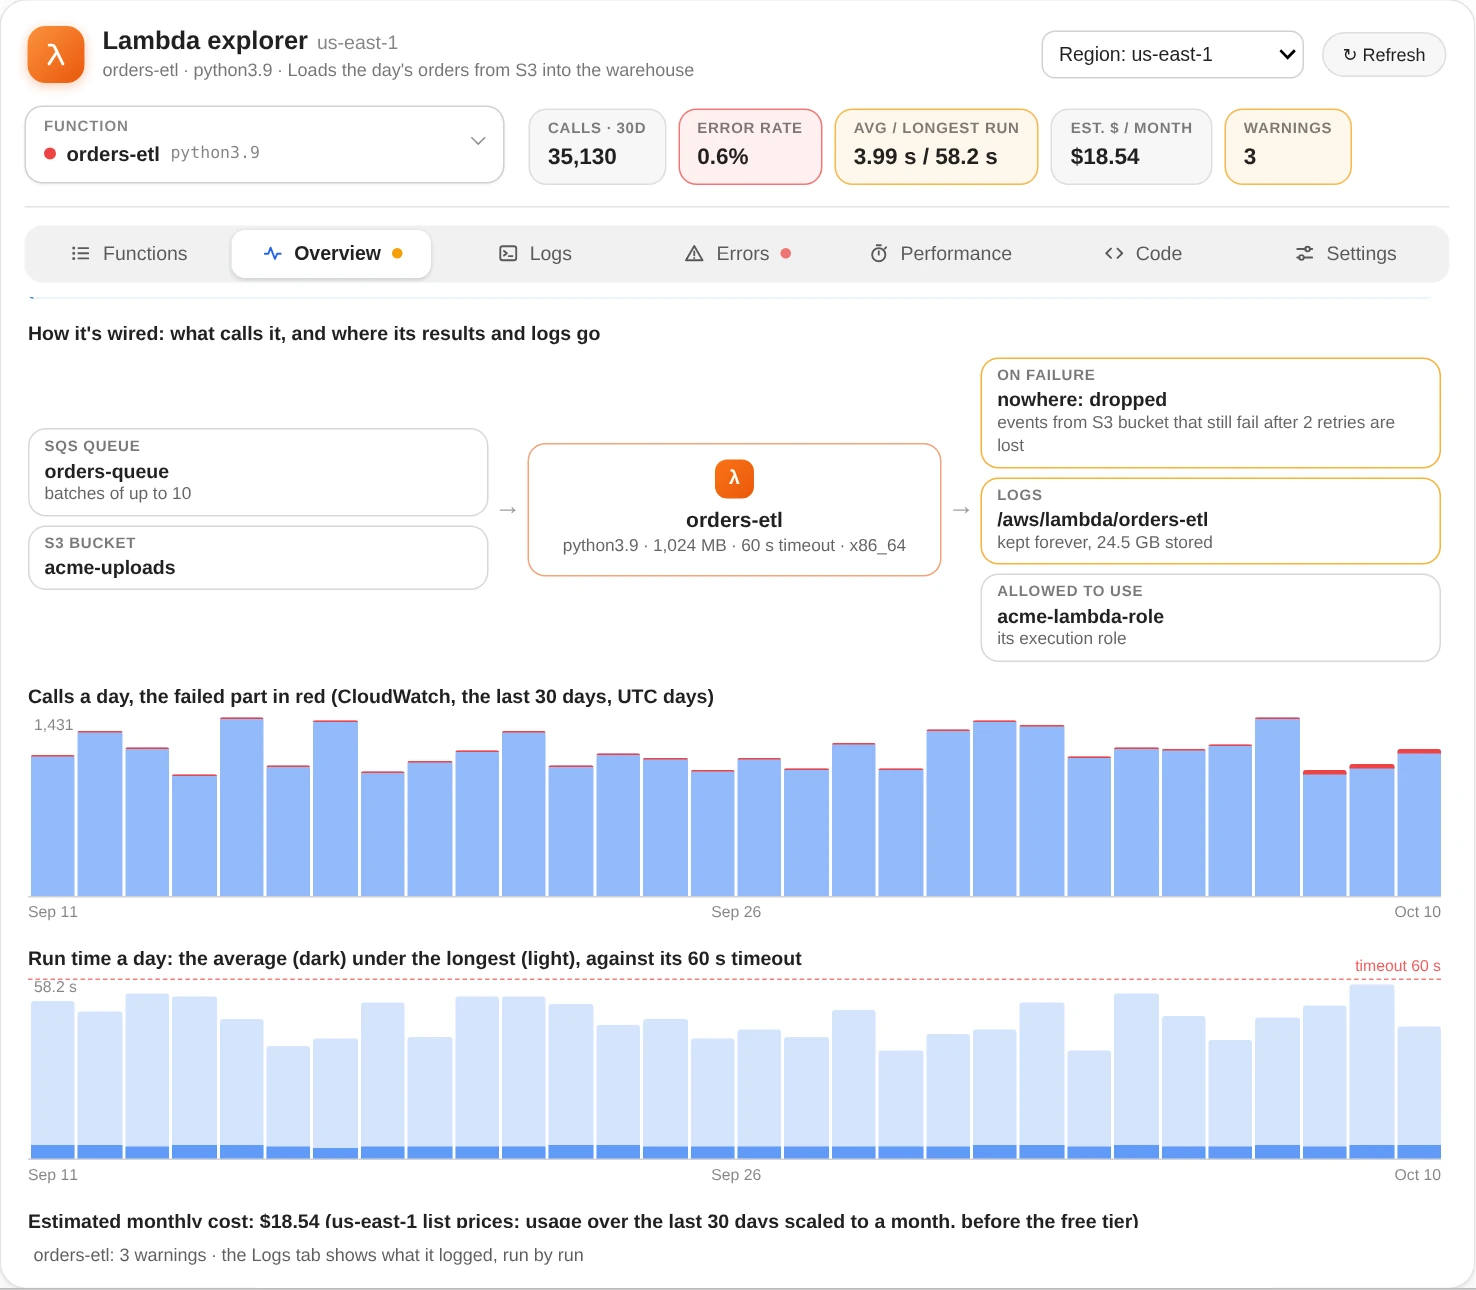
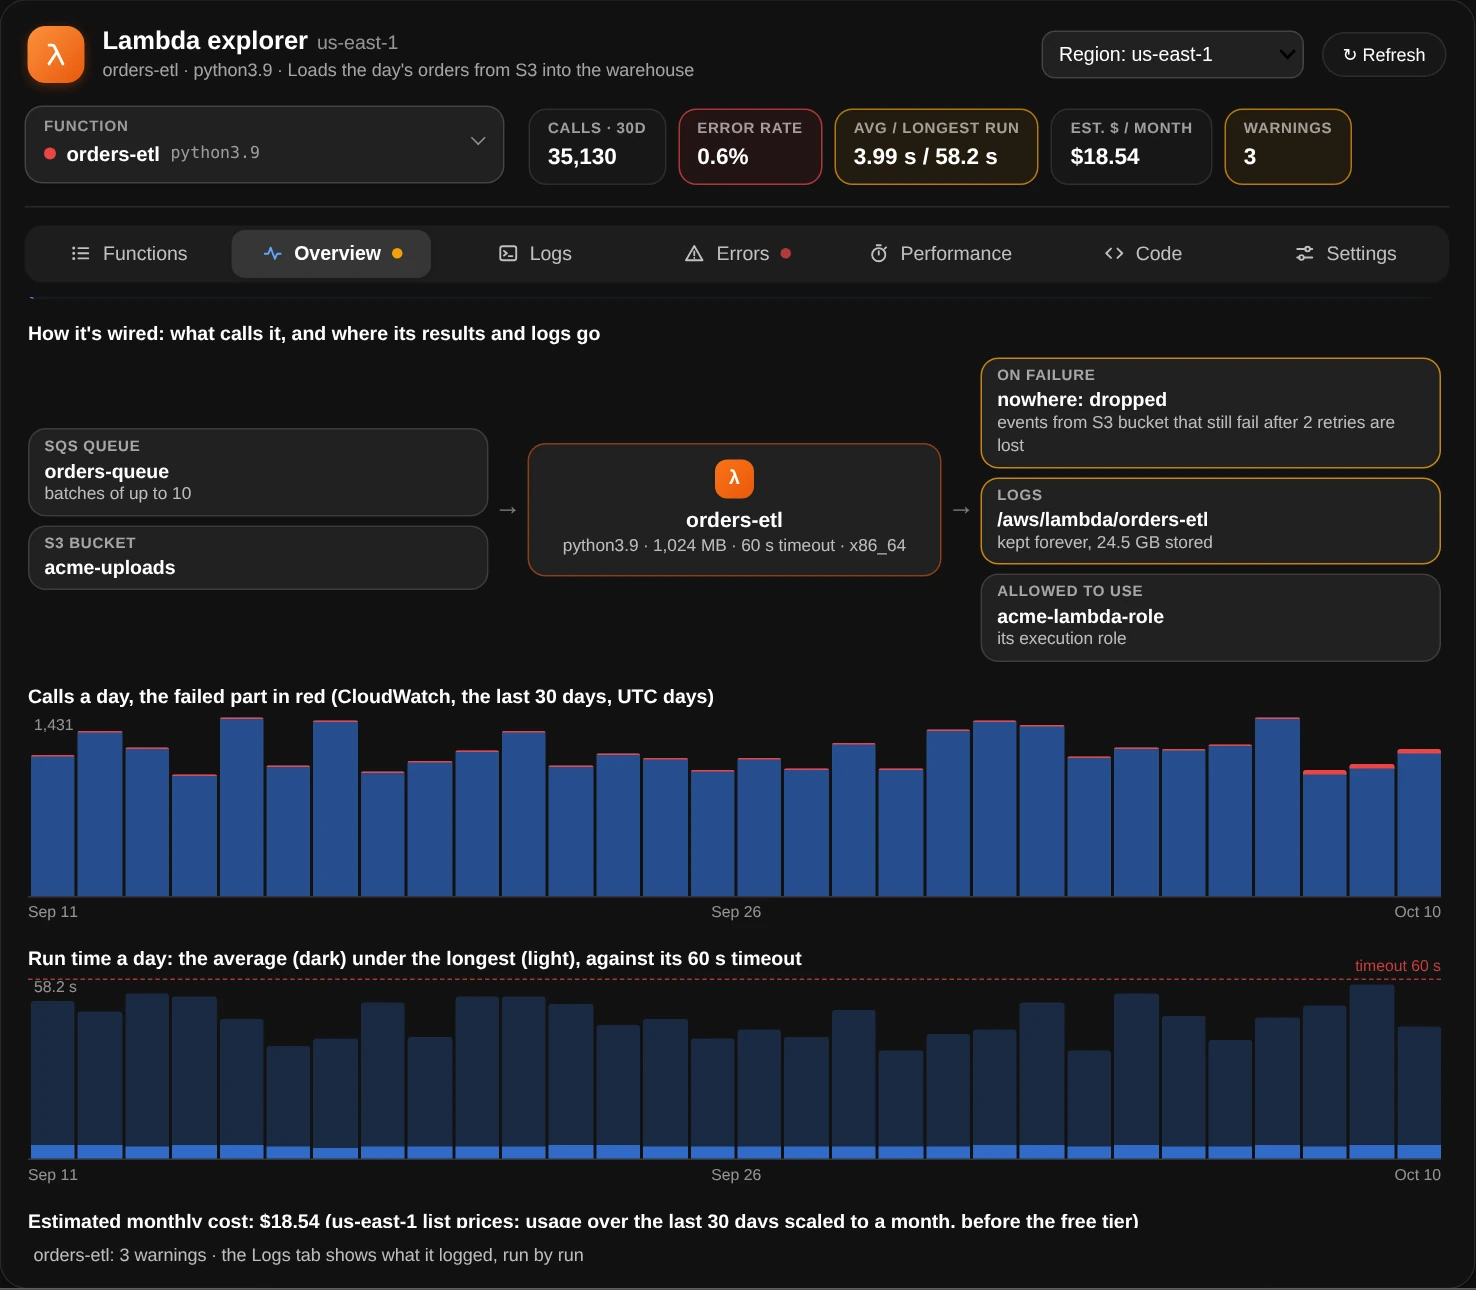
Overview, under the findings: failed S3 events go nowhere, its logs are kept forever, and its longest runs come close to the 60 s timeout.
Errors, run times, code and settings
- Errors is
errors(): the errors in its logs grouped by cause, with what to do about each, then the newest failed runs. Click one to read every line of it in the Logs tab. - Performance is
performance(): run times against the timeout, the memory used against what it has and the size that would do, cold starts, and the slowest runs, each a click from its lines. - Code downloads the deployment package once and lists its files, the handler's first; click one to see its source, with line numbers, and Python and JSON in colour. A secrets file (
.env, keys) is listed but its text isn't shown, and a package over 50 MB is downloaded only when you click Download it anyway. - Settings has every setting in plain English, then the configuration as Lambda returns it, folded, and the AWS CLI commands that read it. Environment variable values never appear.
The Errors and Performance tabs read the last 24 hours, and have their own time range.
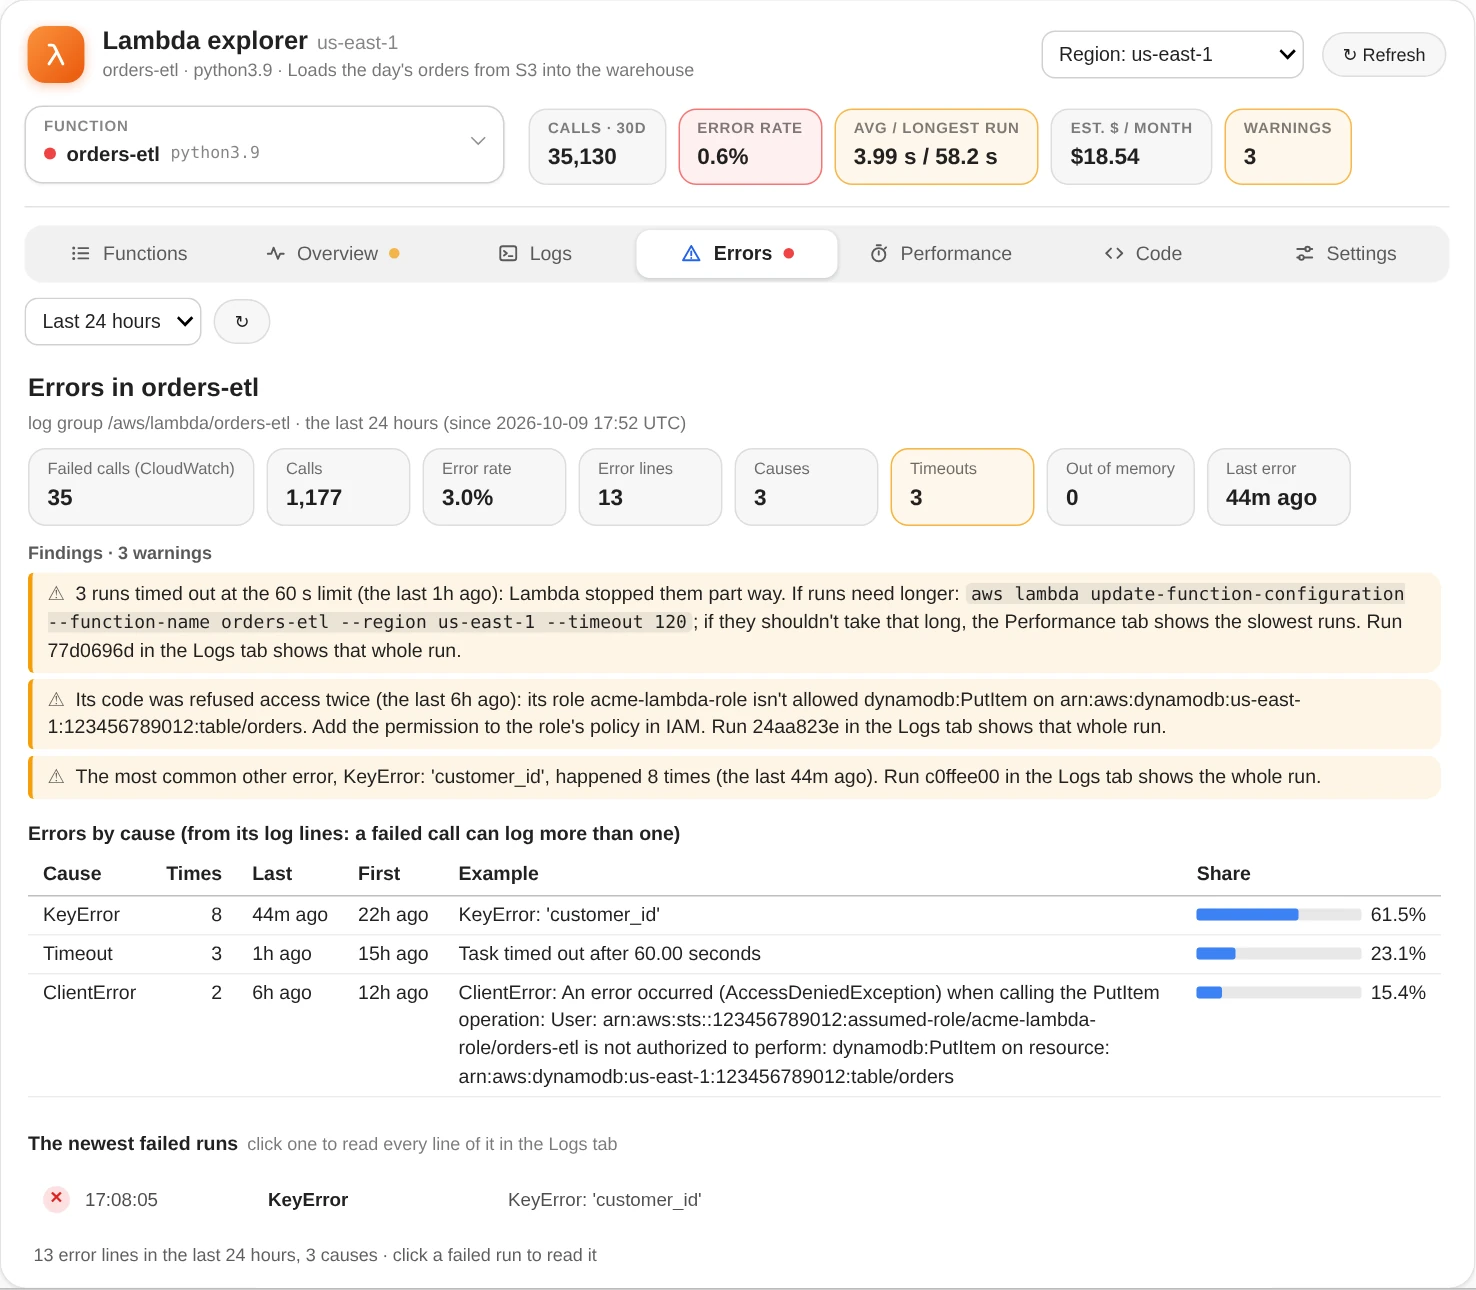
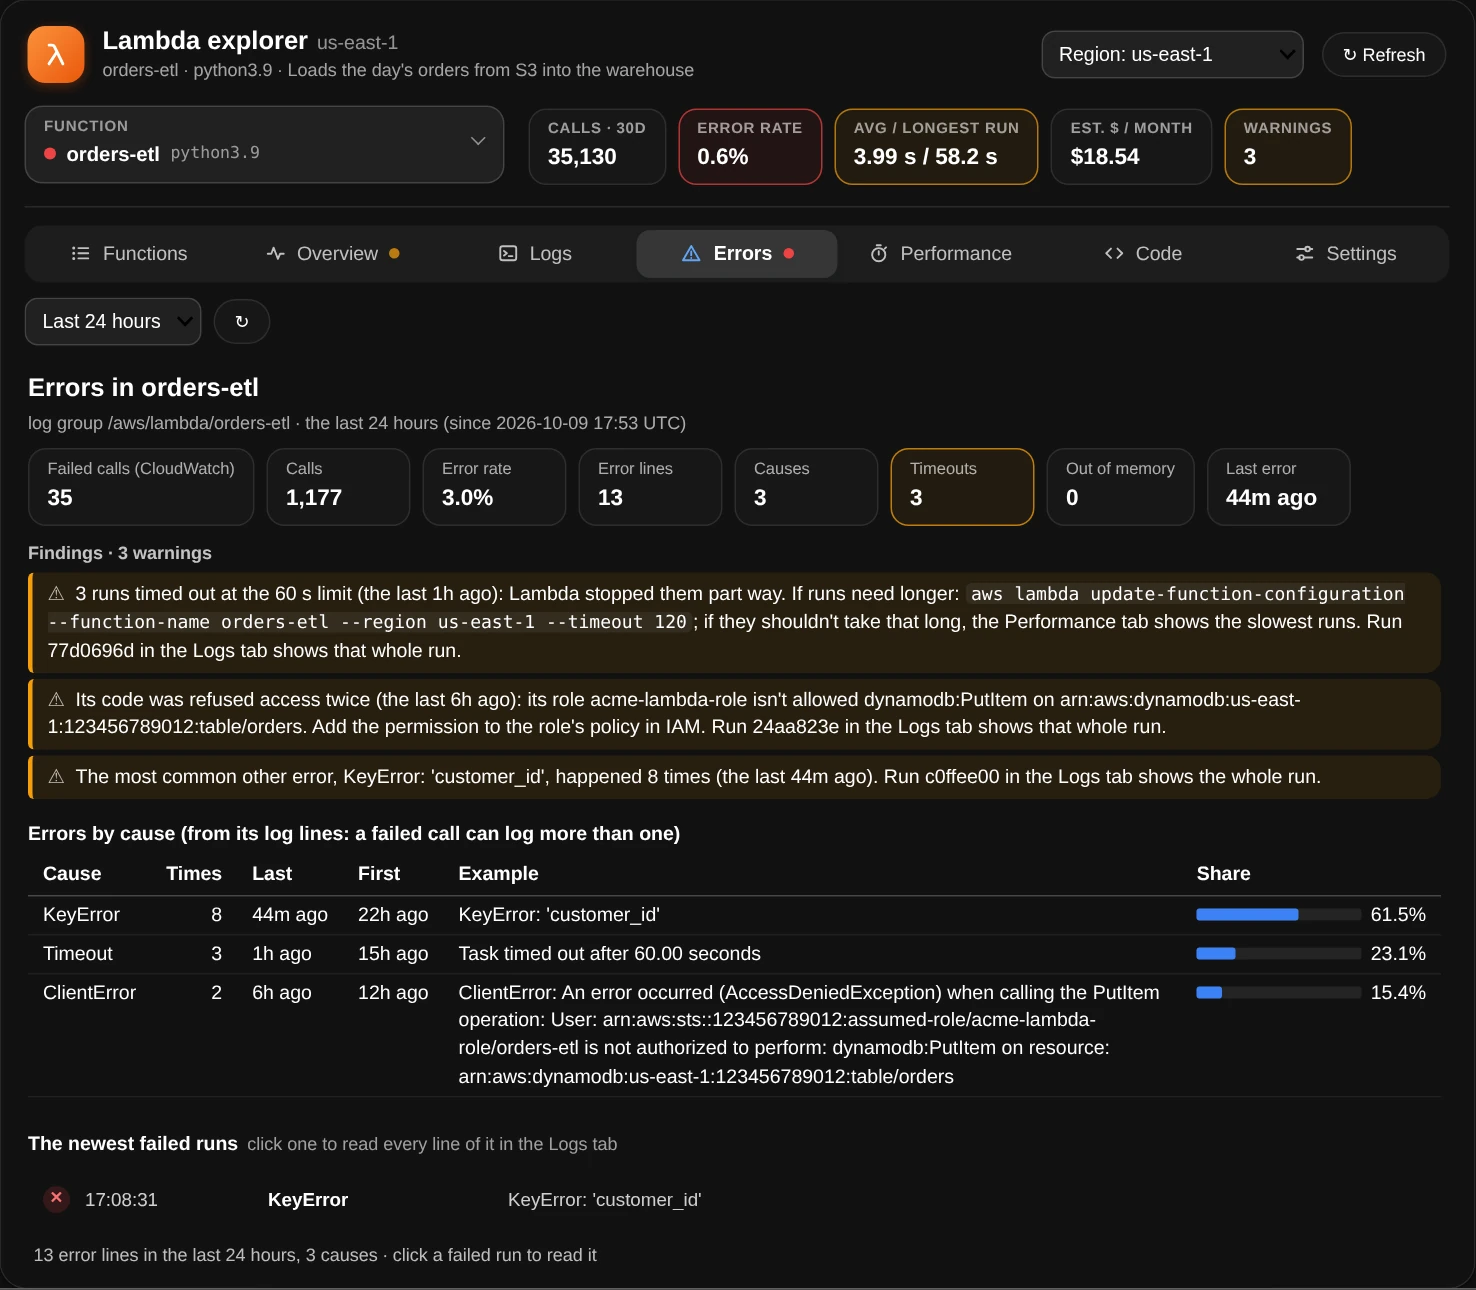
Errors: three causes, each with what to do; the failed runs under them open in the Logs tab.
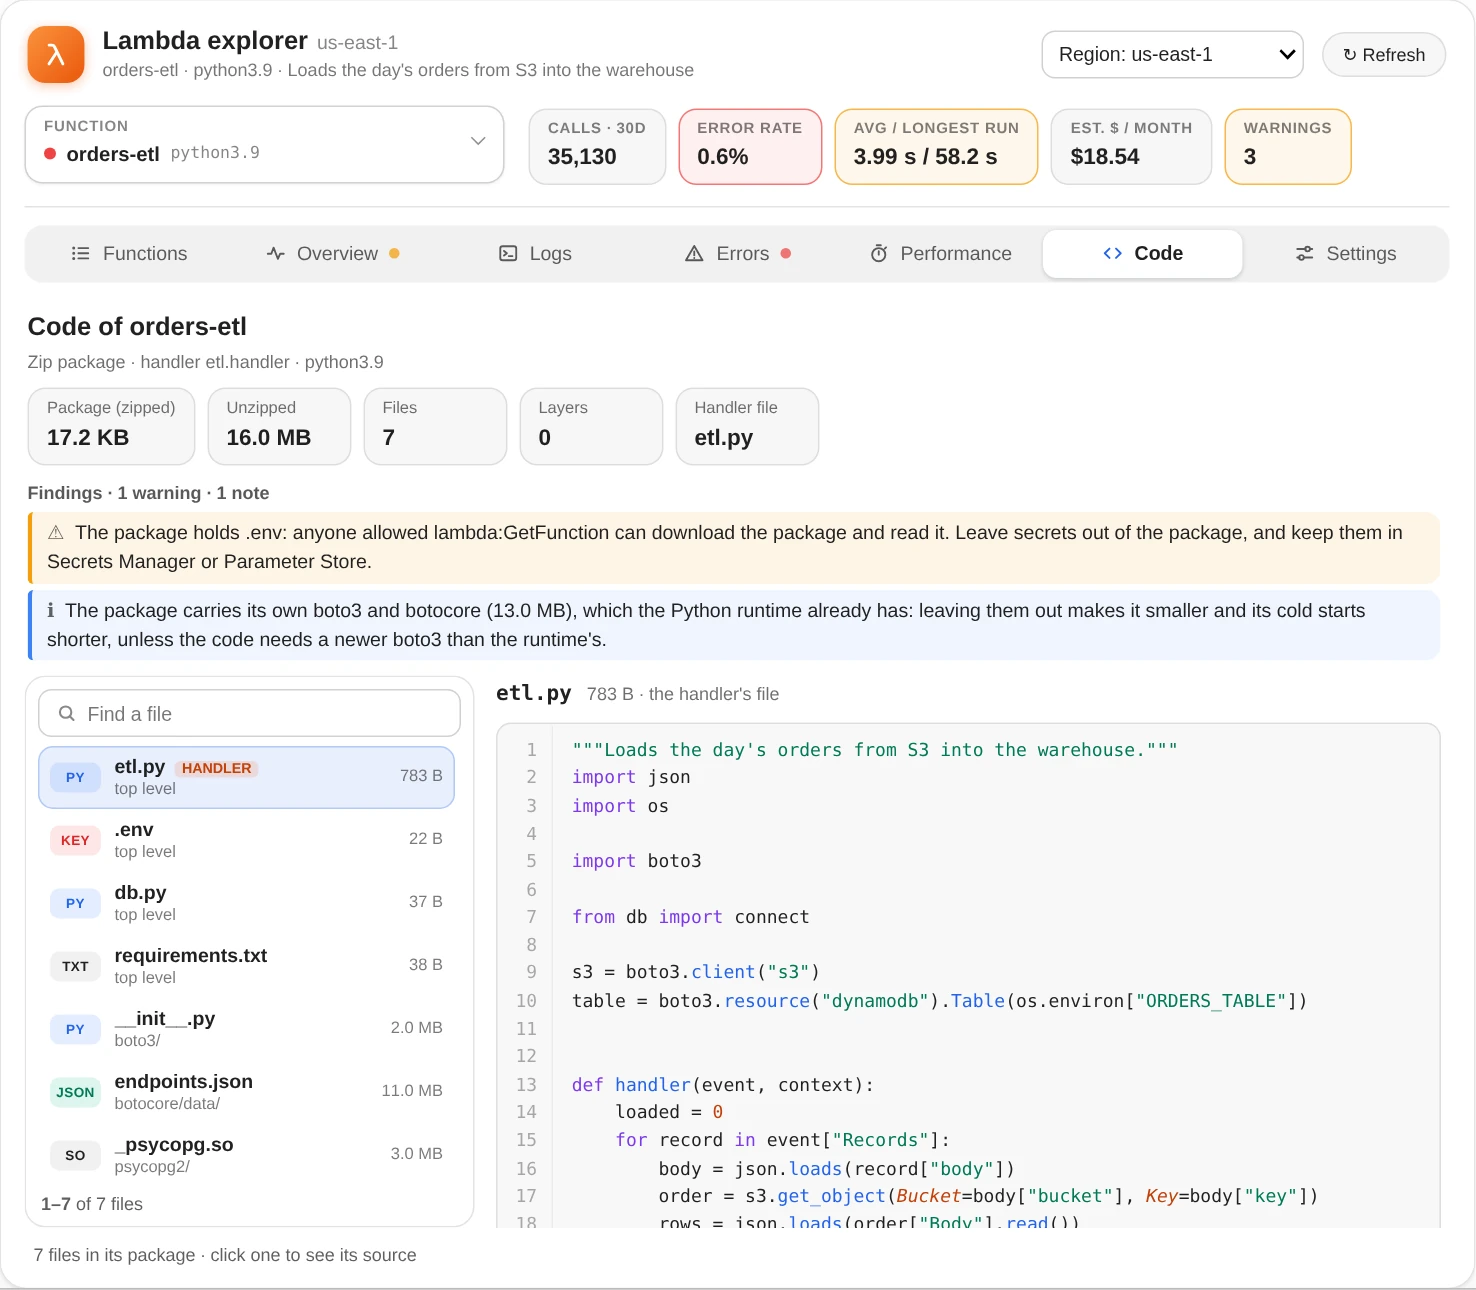
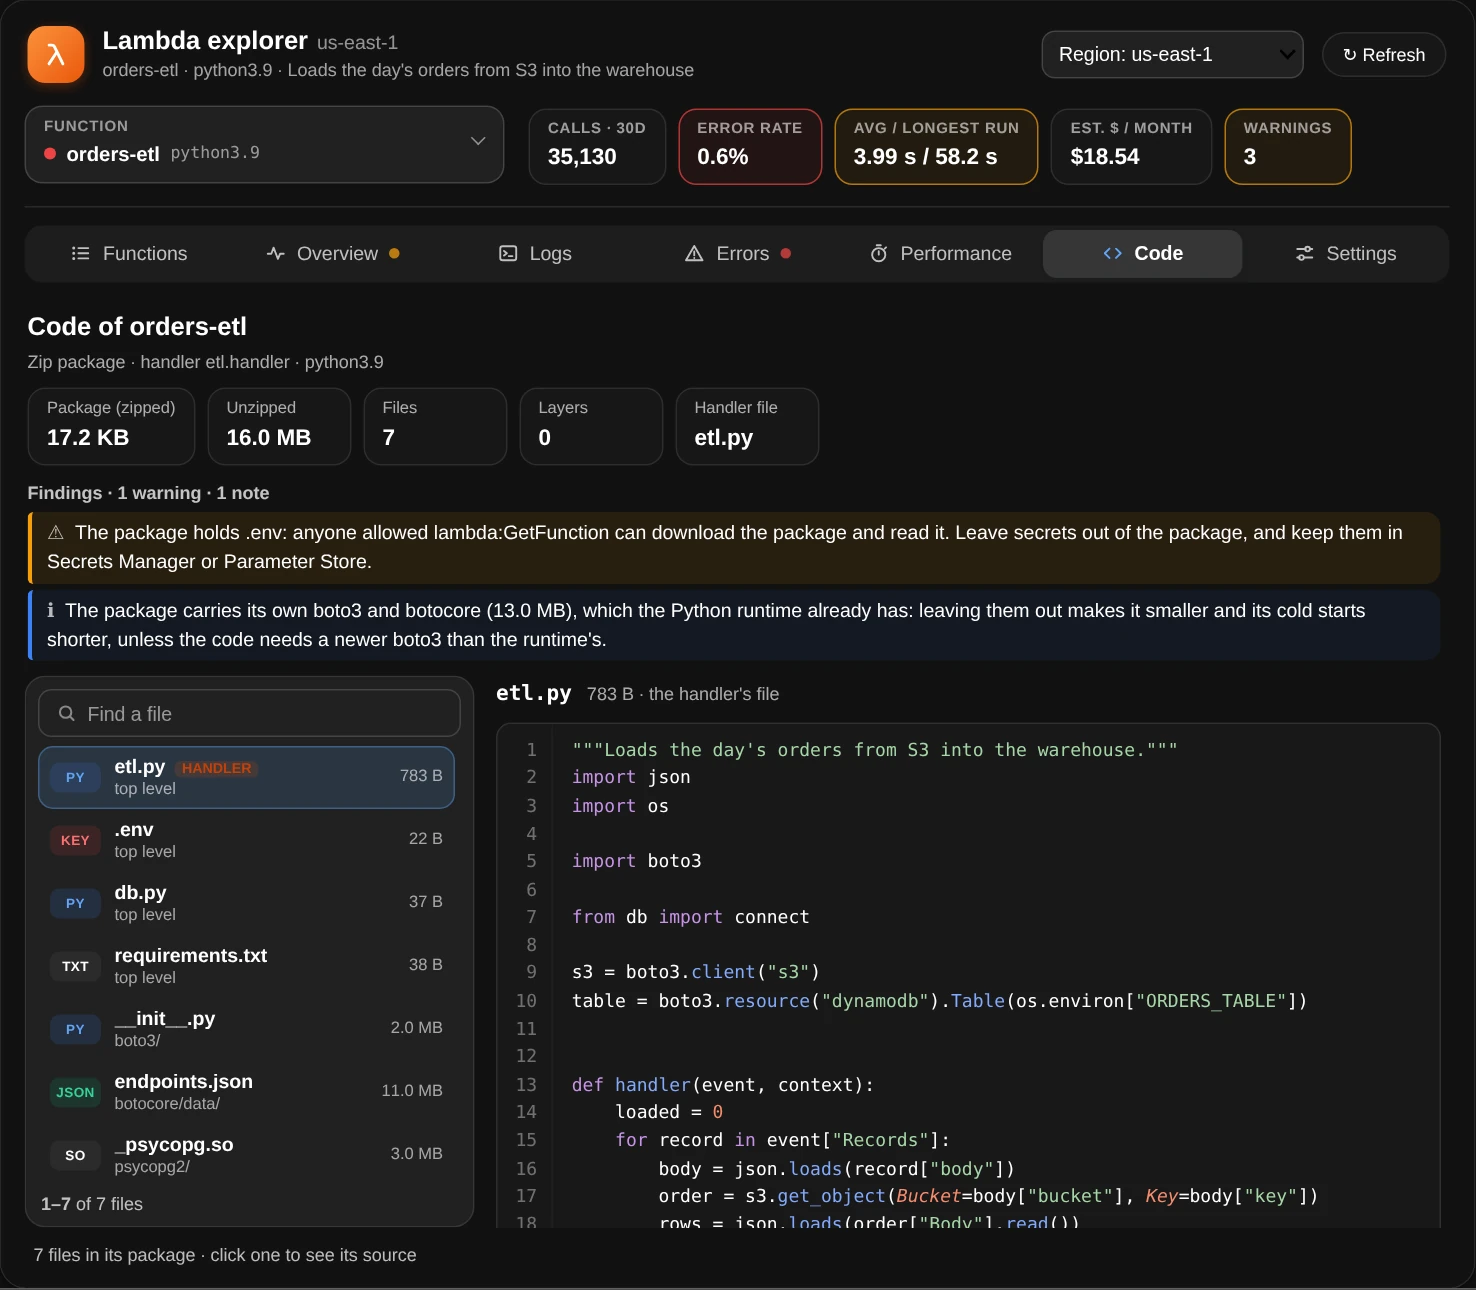
Code: the handler's source, and a .env file that shouldn't be in the package.
Everything is read in the background: a click shows what's known at once and fills in the rest as it arrives, and the window keeps answering meanwhile. explore() returns the window: x.overview, x.function, x.detail, x.logs_page and x.package hold the data behind what's shown; x.open("report-api"), x.logs(search="KeyError", since="24h"), x.run("c0ffee00-1d2e-4f3a-9b8c-7d6e5f4a3b2c") and x.refresh() do what the clicks do; and x.ui is a LambdaView for reports in other cells.
Every function
functions() lists every function in the region with what CloudWatch counted for it over the last 30 days. It's the place to start: one table answers what you have, what's failing, what costs money and what needs attention.
ui.functions(regions="all")
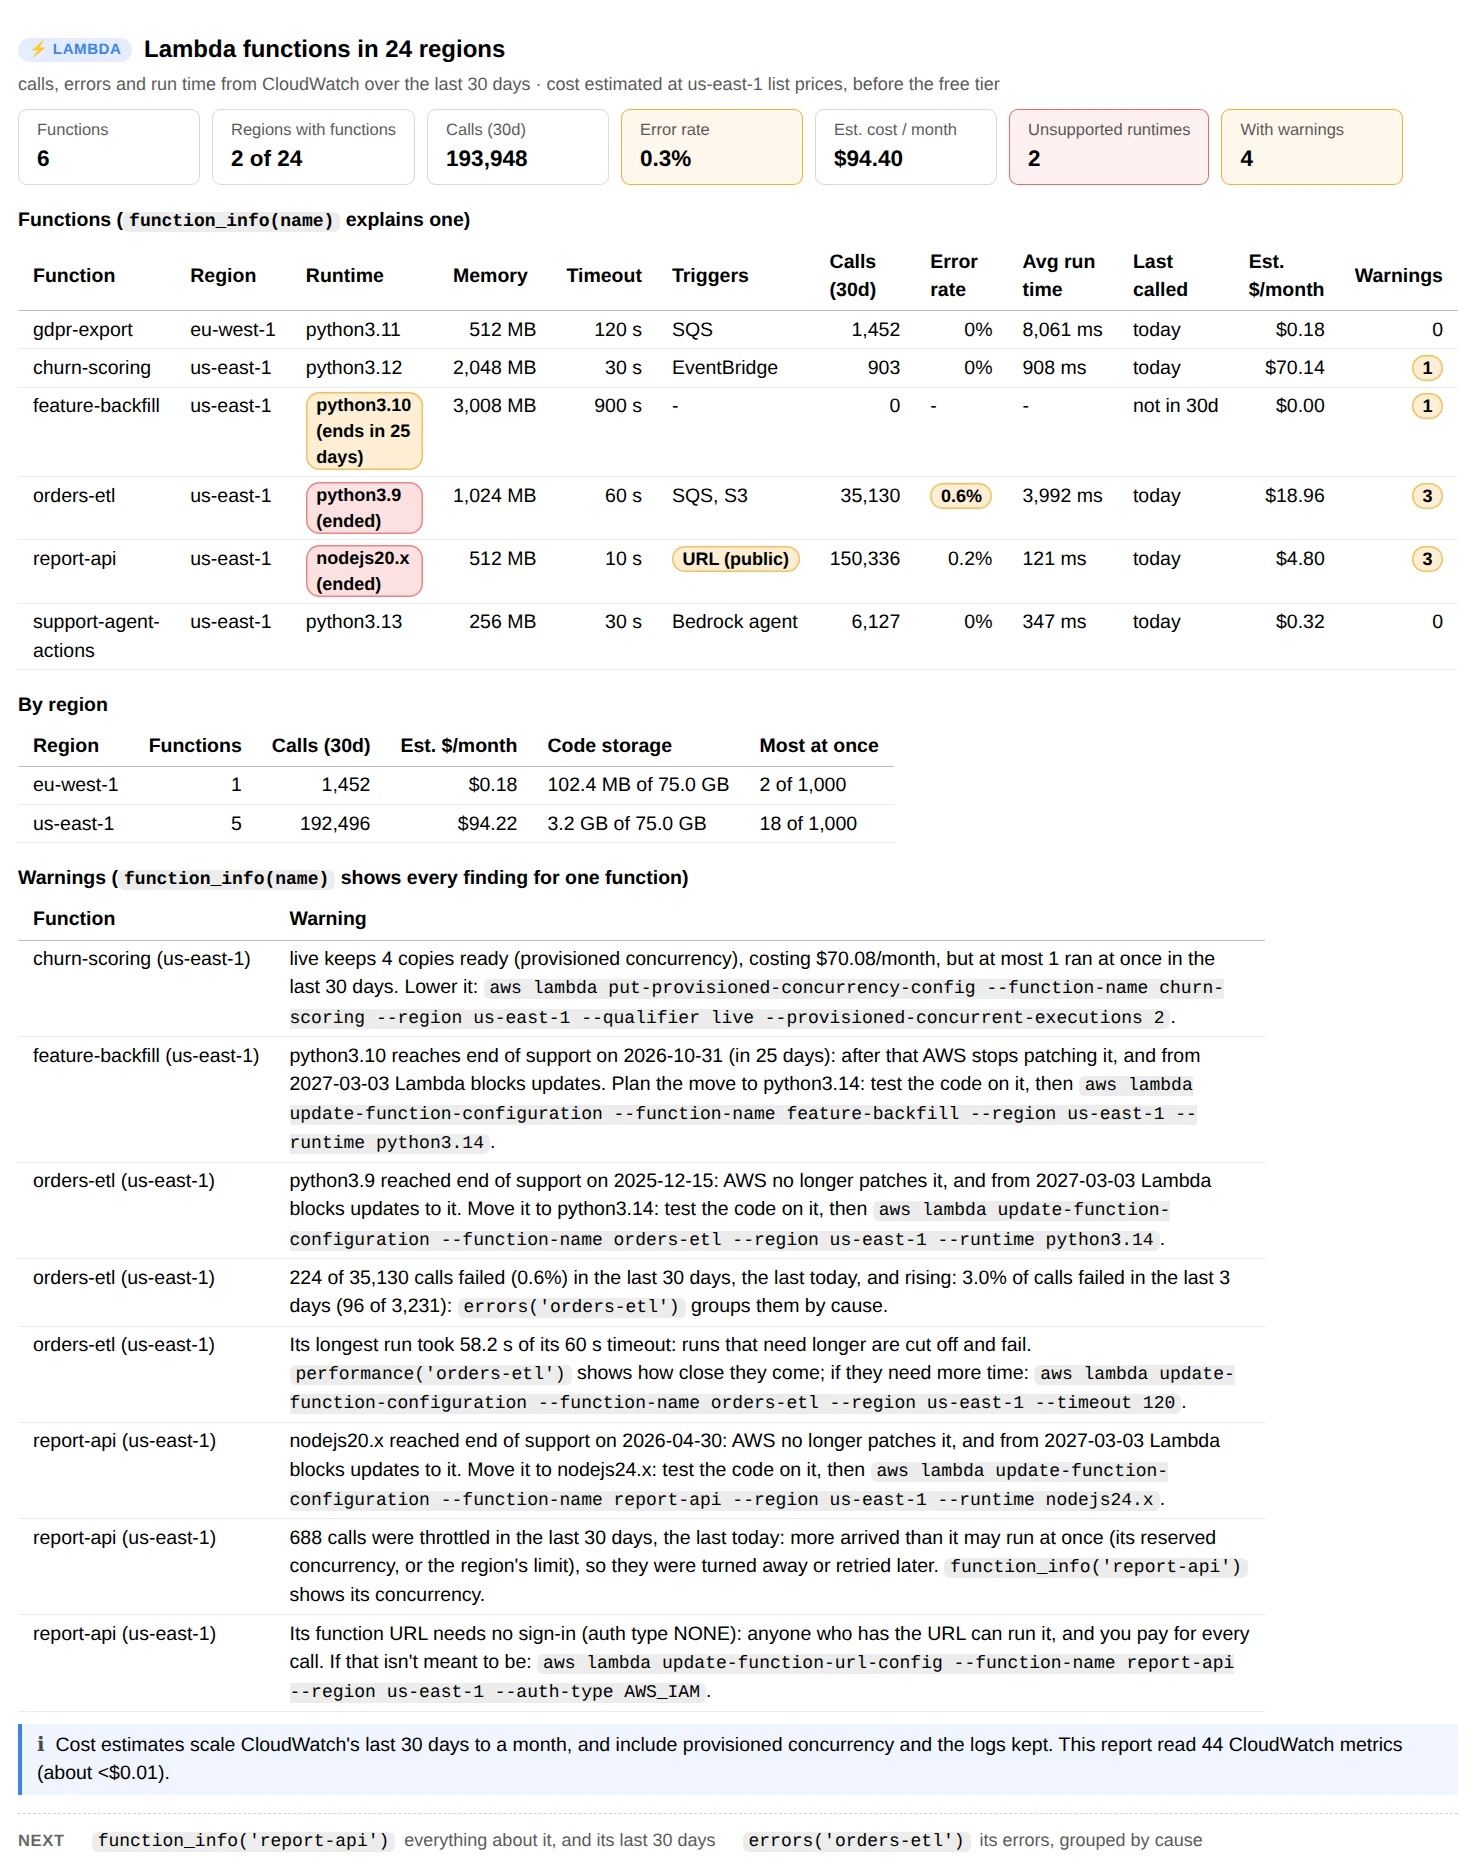
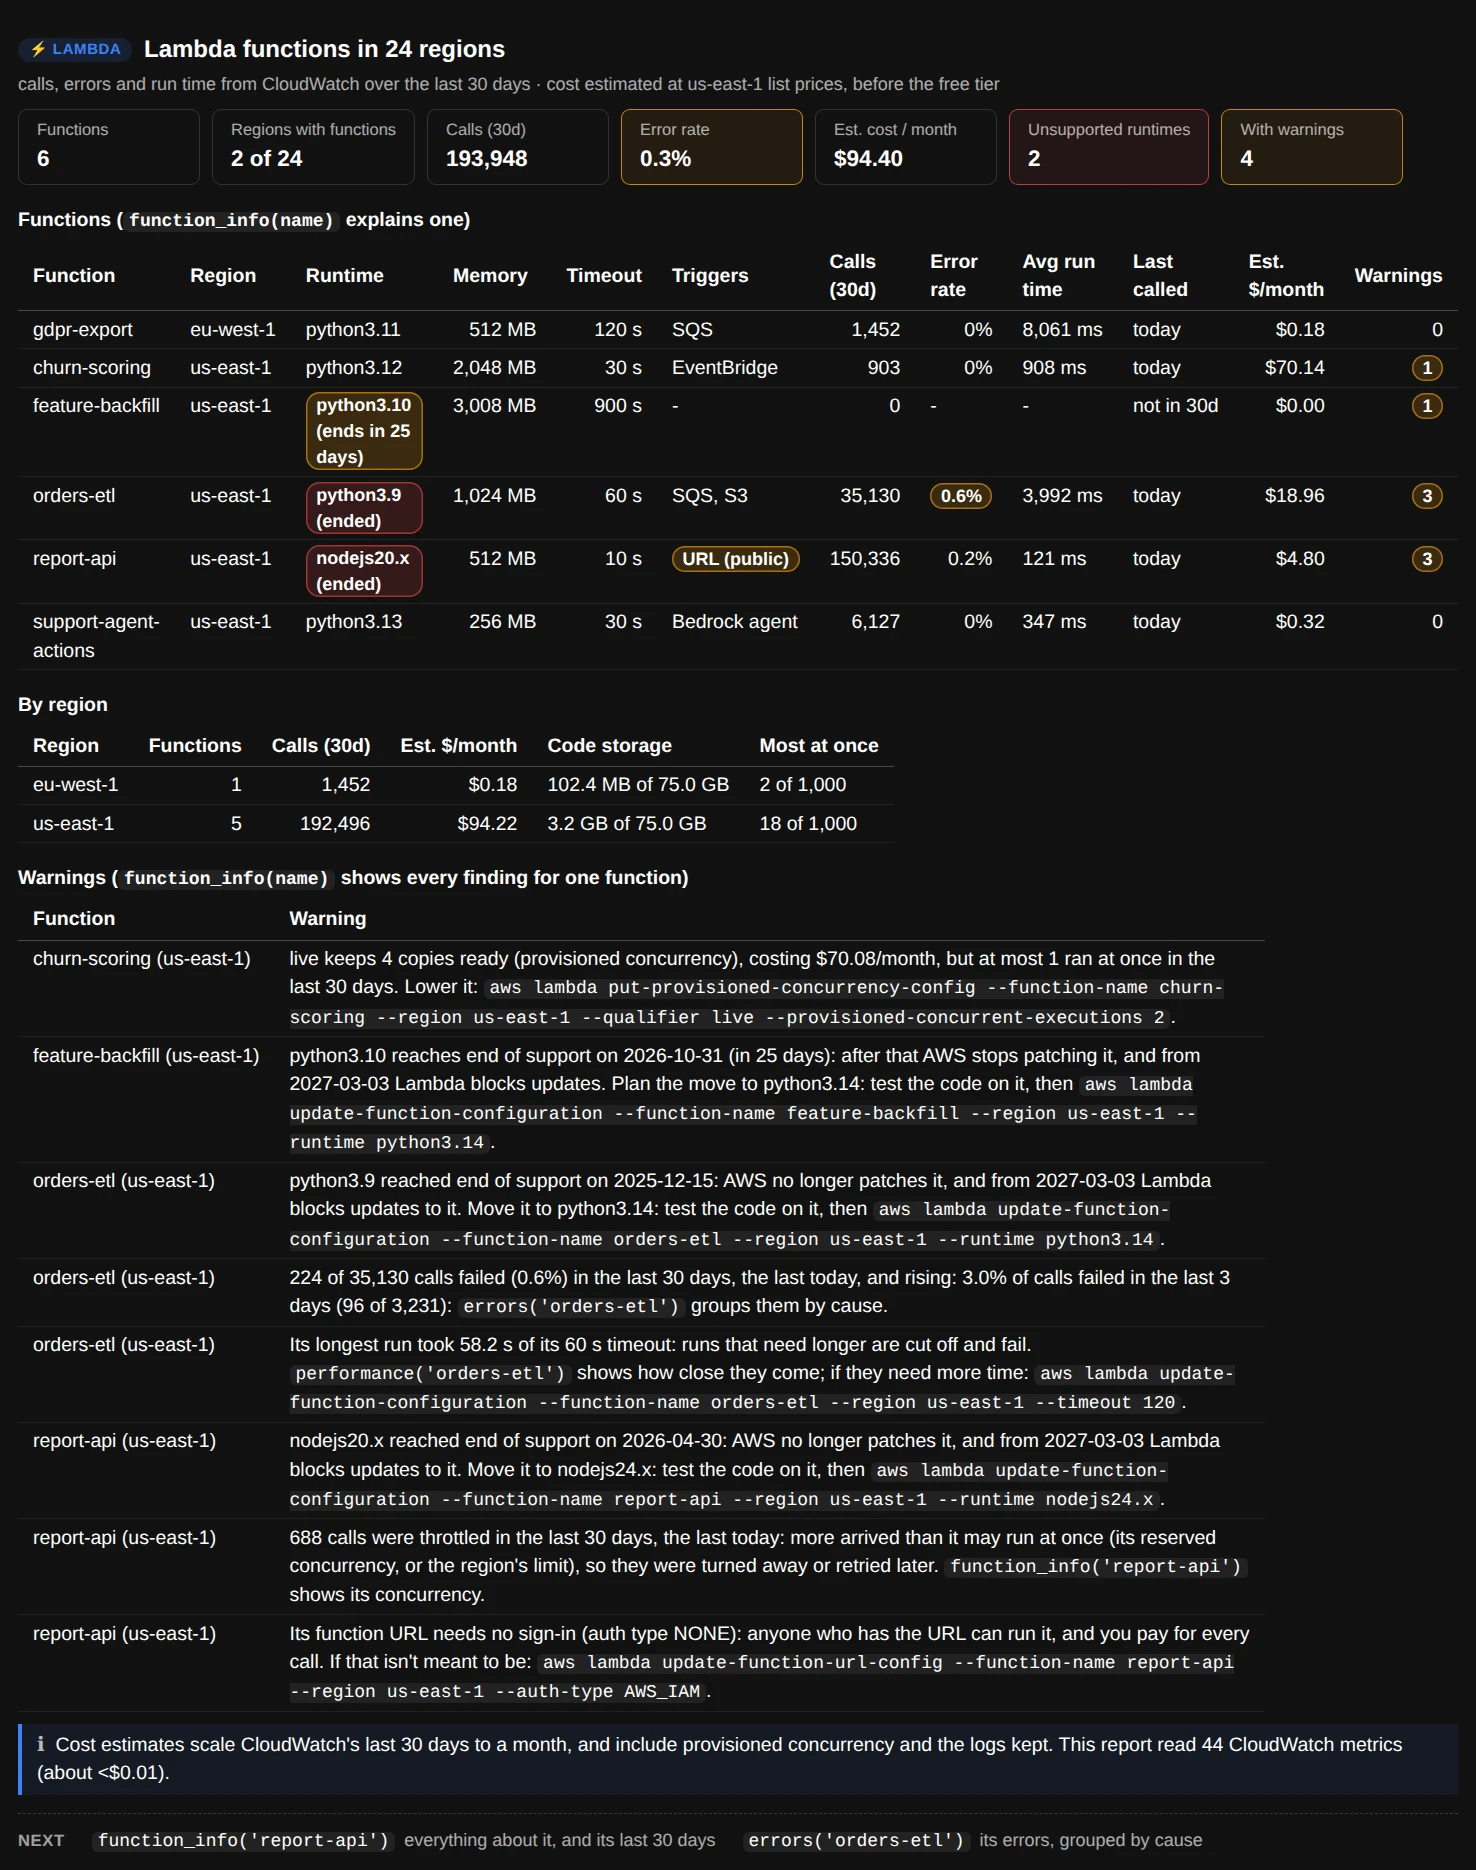
ui.functions(regions="all"): two runtimes AWS no longer patches, $70 a month of provisioned concurrency for a function that never runs two at once, and 3% of calls failing in the last three days, against 0.6% over the month.
- Runtime, marked when AWS has ended its support (no more security patches) or ends it within 90 days. The dates come from AWS's published schedule (
RUNTIMESin the file); Runtime support explains them. - Triggers: the queues and streams Lambda reads for it (event source mappings), the services and accounts its resource policy lets call it (S3, EventBridge, API Gateway, a Bedrock agent...), and its function URL. Anyone or URL (public), in amber, means anyone on the internet can run it.
- Calls, error rate, average run time over the last 30 days, and when it was last called, from CloudWatch.
- Est. $/month: calls and run time scaled to a month, plus provisioned concurrency and what its logs cost. Cost has the details.
- Warnings (listed under the table) cover runtimes past or near the end of support, functions anyone can invoke, provisioned concurrency that sits idle, errors that are frequent or rising, throttled calls, runs close to the timeout, and failed updates.
function_info()shows every finding for one function.
match="etl-*" keeps the functions whose names match. metrics=False skips CloudWatch, and details=False skips the reads made for each function (its resource policy and provisioned concurrency), which makes accounts with hundreds of functions quicker.
Across regions
functions(regions="all") reads every region your account has turned on (from EC2's DescribeRegions; without that permission, every region Lambda is offered in, skipping the ones that answer that they aren't turned on). regions=["us-east-1", "eu-west-1"] or regions="us-east-1, eu-west-1" reads just those. The table gains a Region column, and a By region table shows each region's functions, cost, code storage against its limit, and the most runs that happened at once against the region's concurrency limit.
One function
function_info() explains one function: everything Lambda knows about it, in plain English, and what CloudWatch counted for it, day by day.
ui.function_info("orders-etl")
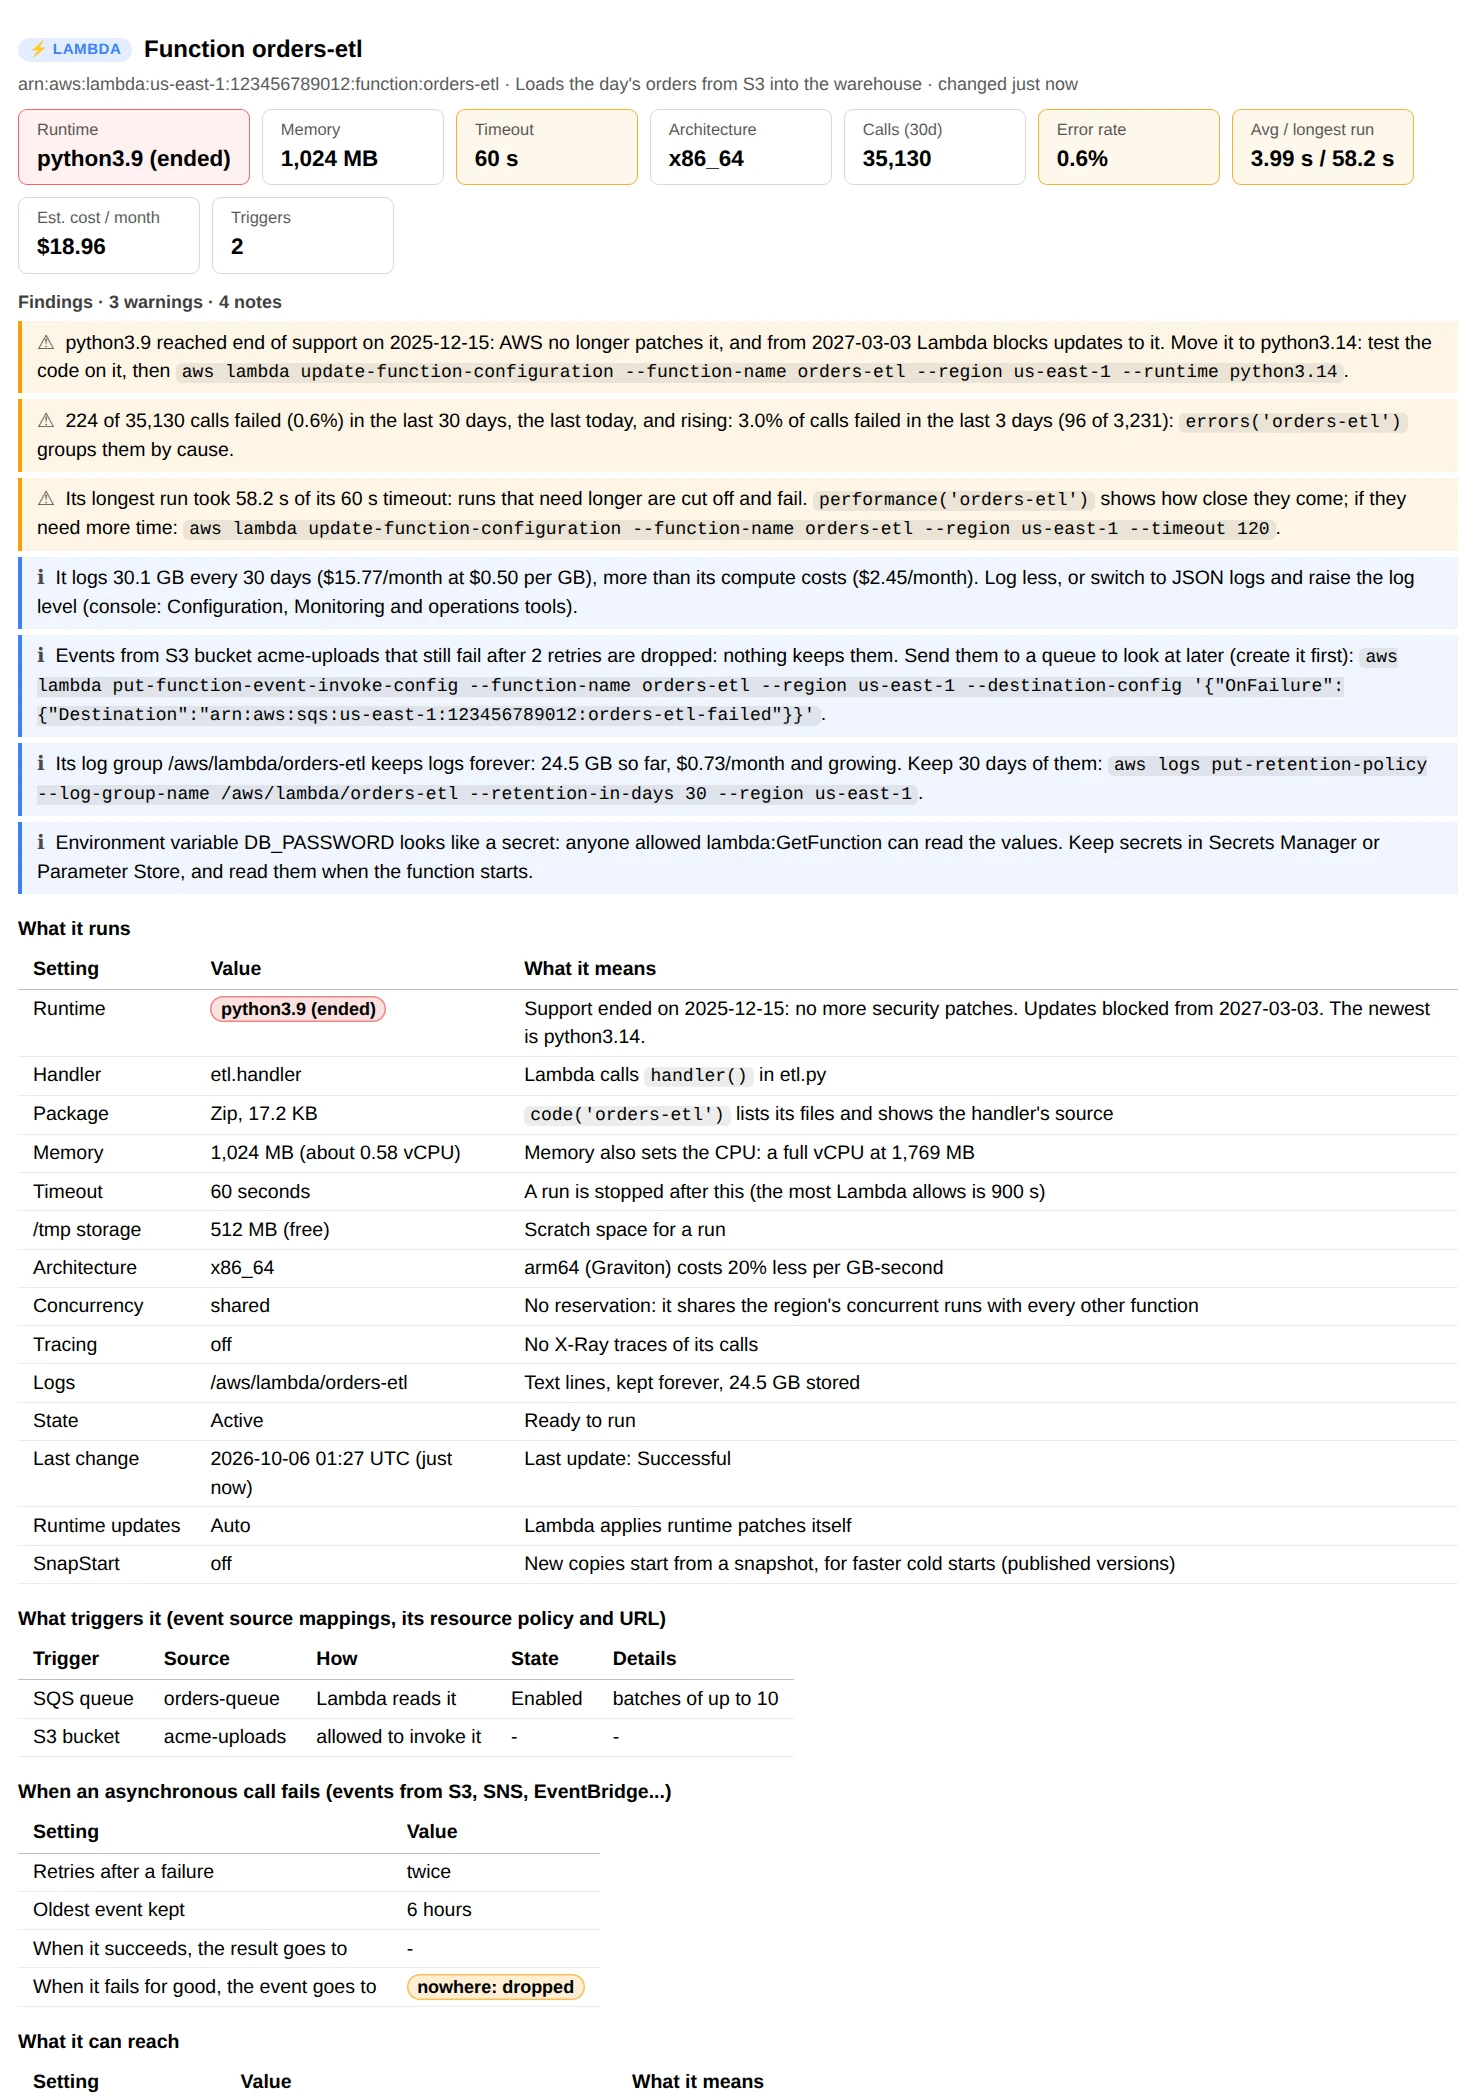
ui.function_info("orders-etl"): its logs cost six times its compute, and failed S3 events are dropped because nothing catches them.
The report's tables:
- What it runs: the runtime and its support dates, the handler (which file and function Lambda calls), the package's size and layers, memory and the CPU it buys (a full vCPU at 1,769 MB), timeout,
/tmpstorage, architecture, reserved concurrency, tracing, where its logs go and how long they're kept, and whether Lambda patches its runtime itself. - What triggers it: each event source mapping with its batch size, state and last result, each service or account its resource policy allows, and its function URL with its auth type.
- When an asynchronous call fails: for functions that S3, SNS or EventBridge call asynchronously, how many times Lambda retries a failed event, how old an event may get, and where it goes when it fails for good. With no on-failure destination or dead-letter queue, it's dropped.
- What it can reach: its execution role (what its code may do in AWS), its network (a VPC reaches the internet only through a NAT gateway or VPC endpoints), and the names of its environment variables.
- Versions, aliases and provisioned concurrency, with what each provisioned copy costs.
- The last 30 days, one row per day: calls, errors, throttles, average and longest run.
- The estimated monthly cost, by part, and the configuration as Lambda returns it, folded away, with environment values hidden.
days=7 reads a shorter window. The findings each end in the command to run: the update-function-configuration call that moves it to a supported runtime or raises its timeout, the put-retention-policy call that stops its logs being kept forever, the put-function-event-invoke-config call that catches failed events.
Runtime support
AWS supports each managed runtime (python3.12, nodejs22.x, java21...) for a while after the language version is released, then:
| Date | What happens |
|---|---|
| End of support | AWS stops applying security patches. Functions keep running |
| Block function create | No new functions on that runtime |
| Block function update | Existing functions on it can't be updated |
The report marks a runtime ended after its end of support, and warns 90 days before it. It names the newest runtime for the same language, and the update-function-configuration command that moves the function to it: test the code on the new runtime first. A container image has no managed runtime: rebuild it on a current base image now and then.
Who can call it
Lambda functions get called three ways, and the report reads all three:
| How | Where it's set | Examples |
|---|---|---|
| Lambda reads a queue or stream for it | Event source mappings | SQS, Kinesis, DynamoDB streams, Kafka |
| A service or account calls it | The function's resource policy | S3, EventBridge, API Gateway, SNS, a Bedrock agent, another account |
| Anyone calls its HTTPS address | Its function URL | With auth type NONE, anyone who has the URL |
Anyone in the triggers means its resource policy lets any AWS account invoke it, and URL (public) means its function URL needs no sign-in: both are warnings, since anyone can run it and you pay for every call. A service allowed without a source (an S3 permission with no SourceArn) is a note: that service could call it for other accounts' resources too. Functions called directly (an SDK, Step Functions, a service using its own role) leave no trace here, since their permission is on the caller's role.
When something goes wrong
Errors, grouped by cause
errors() reads the function's own logs and groups the errors in them by cause, next to CloudWatch's count of failed and throttled calls.
ui.errors("orders-etl")
ui.errors("orders-etl", since="7d")            # further back
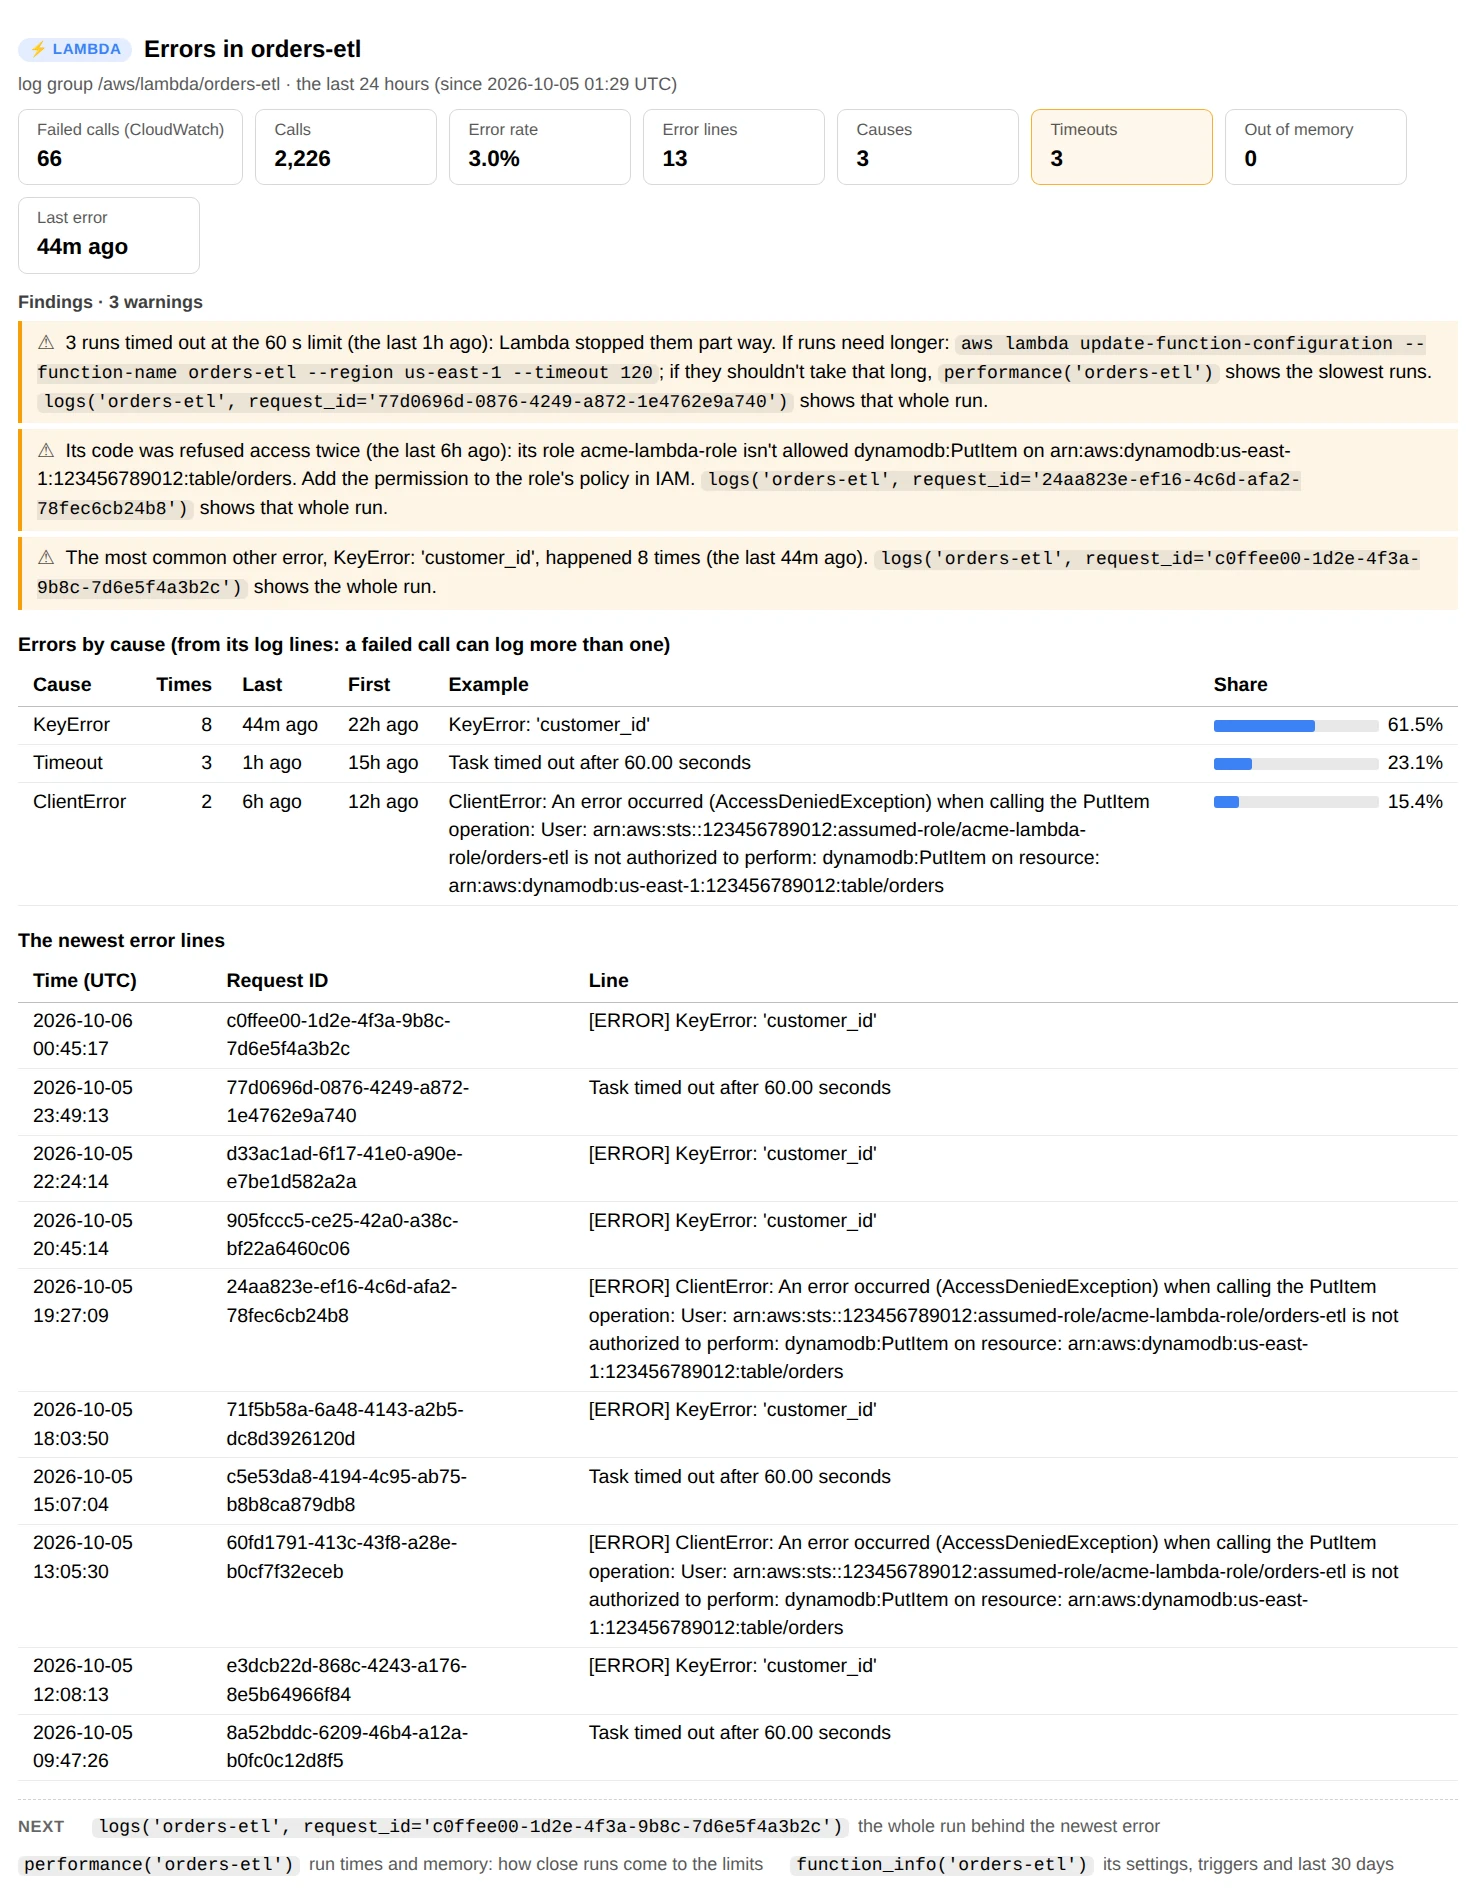
ui.errors("orders-etl"): three different reasons to fail, each with what to do and the run to look at.
Each cause gets its own advice:
- Timeouts: raise the timeout, or find what's slow with
performance(). At 900 seconds there's no more room: split the work, or run it somewhere without the limit. - Out of memory: Lambda killed the run. Give it more memory.
- Code that can't load (
Runtime.ImportModuleError): a package missing from the deployment package or a layer, or a handler setting that doesn't match a file.code()shows what's in the package. - Access denied: the function's role isn't allowed something its code does, named with the action and the resource.
- Throttled or unreachable services, and otherwise the most common error, with an example.
Each error line is matched to its run, by its request ID, or by the REPORT line that ends the run in the same log stream (Python's tracebacks don't carry the ID). logs("orders-etl", request_id="...") then shows that whole run.
Logs
logs() shows the newest lines the function logged, 50 from the last hour, with each run's REPORT line summed up: run time, memory used and cold start. START and END lines are left out.
ui.logs("orders-etl")
ui.logs("orders-etl", search="KeyError")                  # lines with that text (case-sensitive)
ui.logs("orders-etl", search='?ERROR ?WARN')              # or any CloudWatch Logs filter pattern
ui.logs("orders-etl", request_id="c0ffee00-1d2e-4f3a-9b8c-7d6e5f4a3b2c")   # one run, start to end
ui.logs("orders-etl", since="24h", n=200)
request_id= shows every line of one run, including what the code printed without the ID: everything its log stream recorded between the run's first and last line. When the window has no lines, the report says when the newest one was, and the call that reaches back that far.
Run times, memory and cold starts
performance() reads the REPORT line Lambda logs at the end of every run: how long it ran and was billed for, the memory it used, and how long a cold start spent starting up.
ui.performance("orders-etl")
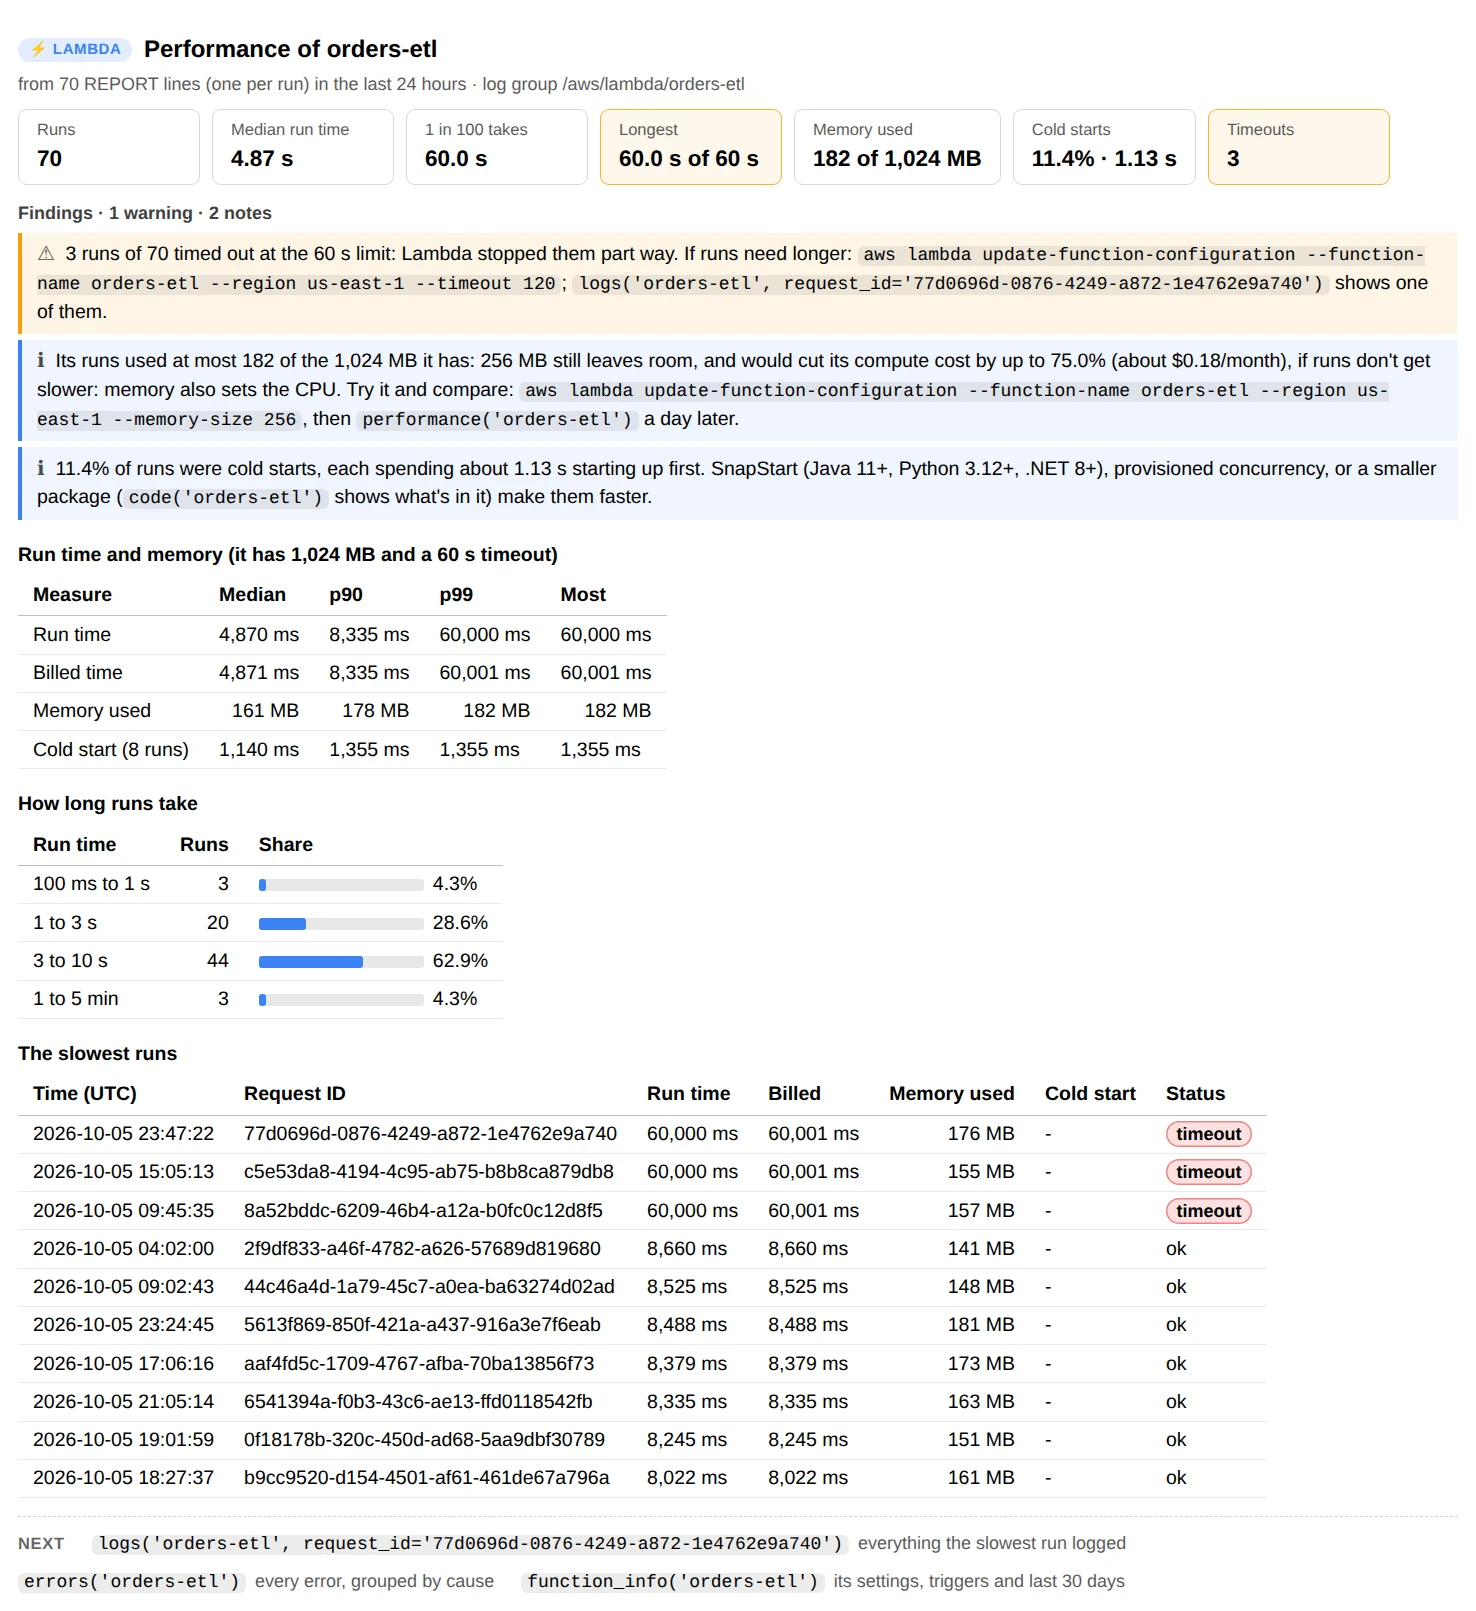
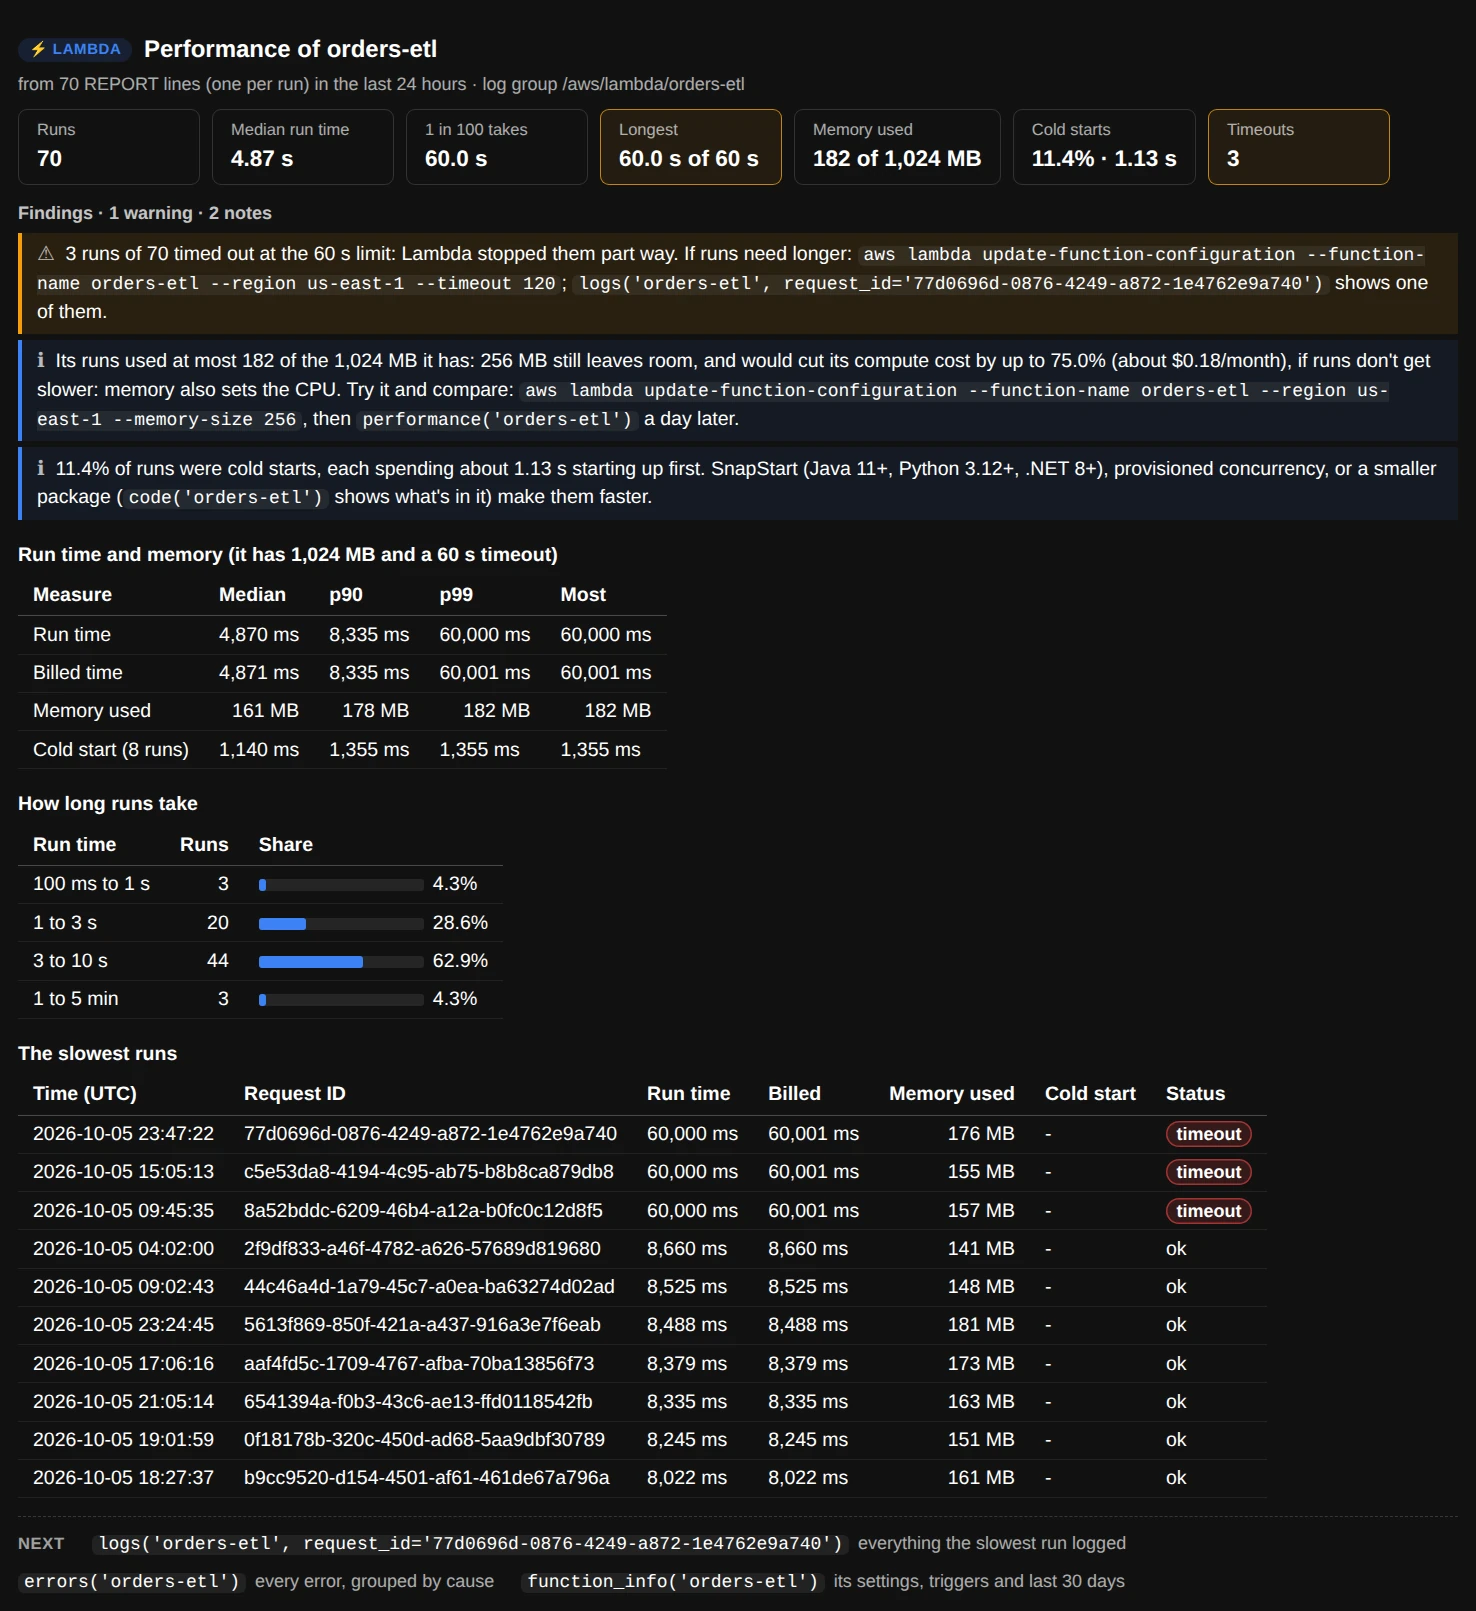
ui.performance("orders-etl"): runs use at most 182 MB of the 1,024 MB it has, and three ran into the 60 s timeout.
Choosing memory. Lambda bills memory × run time, and memory also sets the CPU (a full vCPU at 1,769 MB). When runs use far less memory than the function has, the report suggests a smaller size that still leaves 30% room, never less than a quarter of what it has in one step, and what that would save if the run time stays the same. A function held back by its CPU may run slower with less memory, which can cost more, so try it, and run performance() again a day later. When runs come close to the memory or the timeout, it says so and gives the command that raises them.
Look at the code
code() downloads the deployment package from the link Lambda gives (a short-lived S3 link), lists its files and folders by size, and shows the source of the file that holds the handler. Nothing in it is run, and a secrets file (.env, keys, credentials) is listed but its text isn't shown, because a notebook's output is easy to share.
ui.code("orders-etl")
ui.code("orders-etl", "db.py")           # another file: a path, a name, or a glob like "*.py"
ui.code("orders-etl", max_size="200MB")  # packages up to 50 MB are read by default
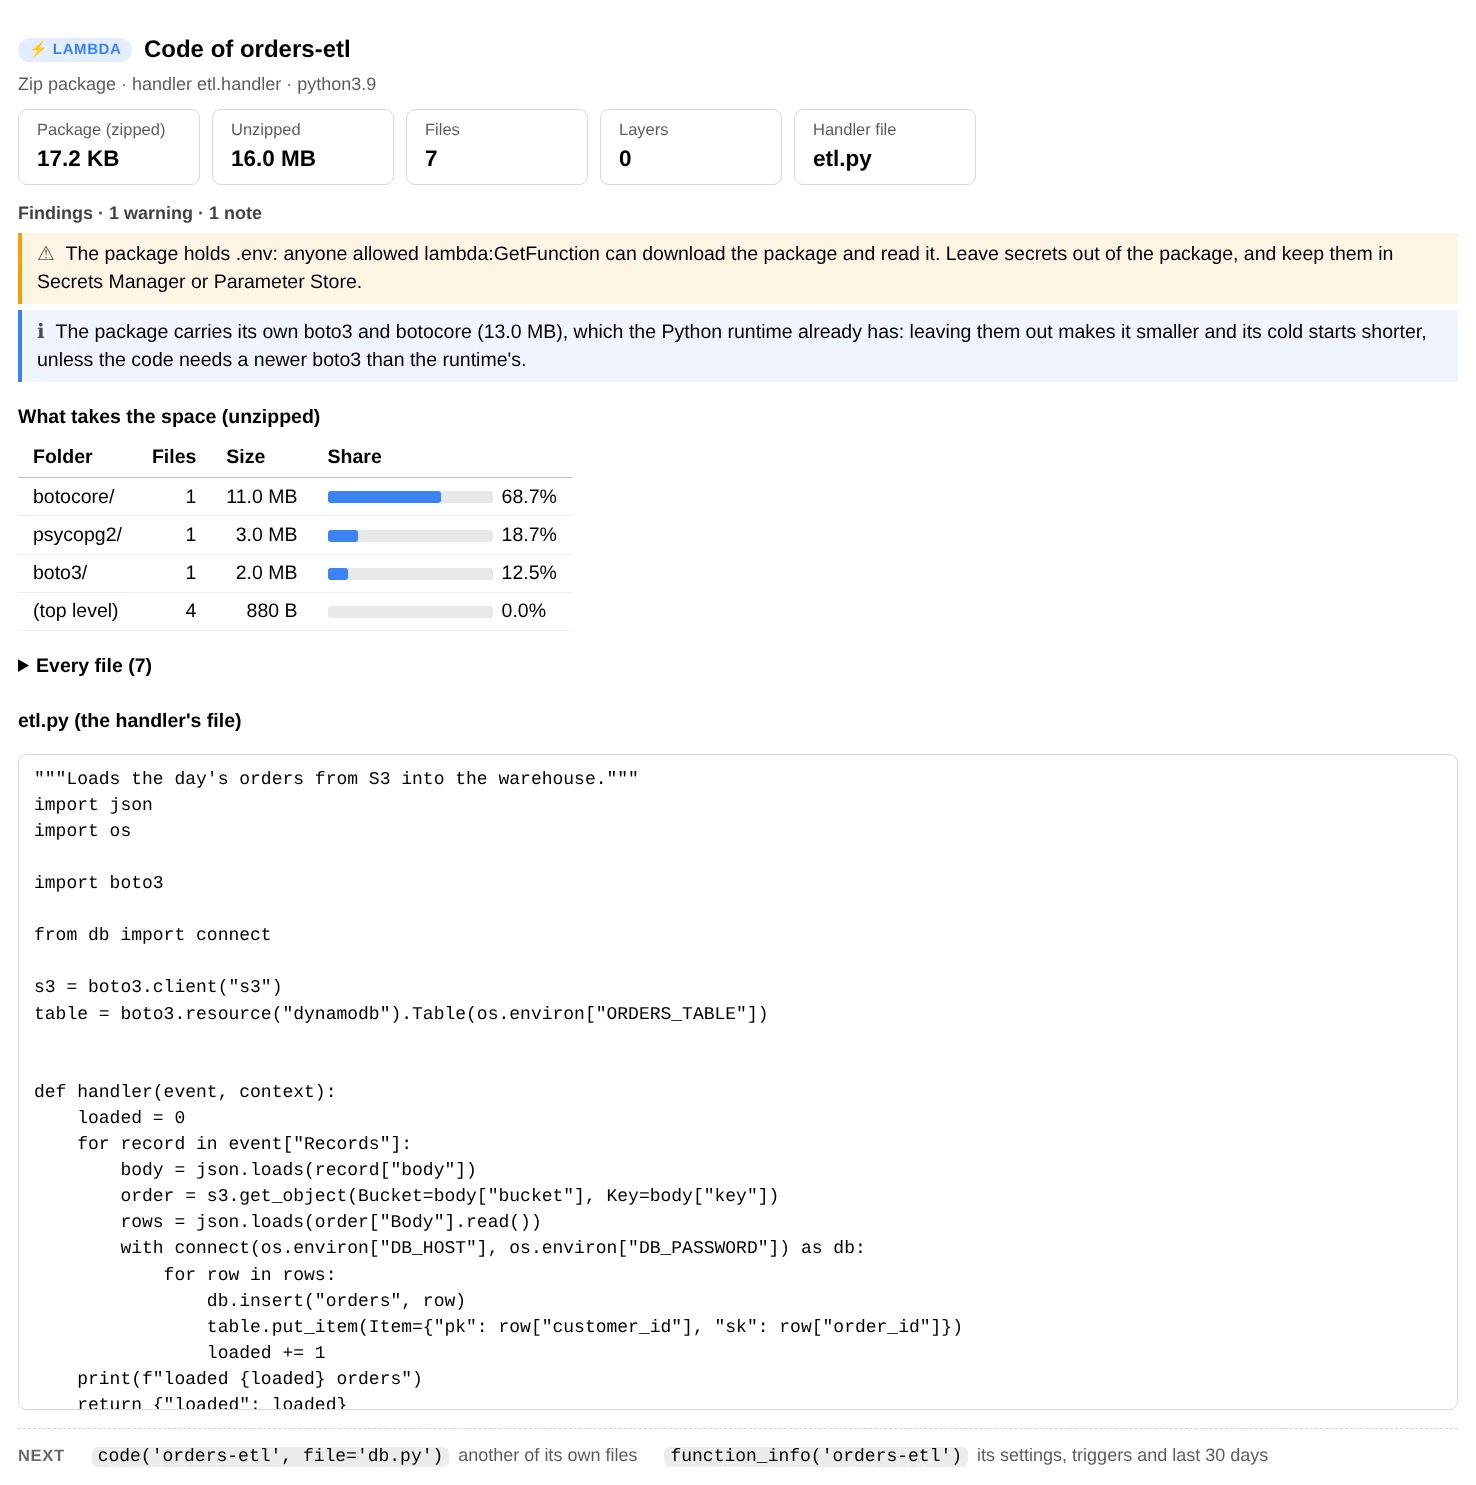
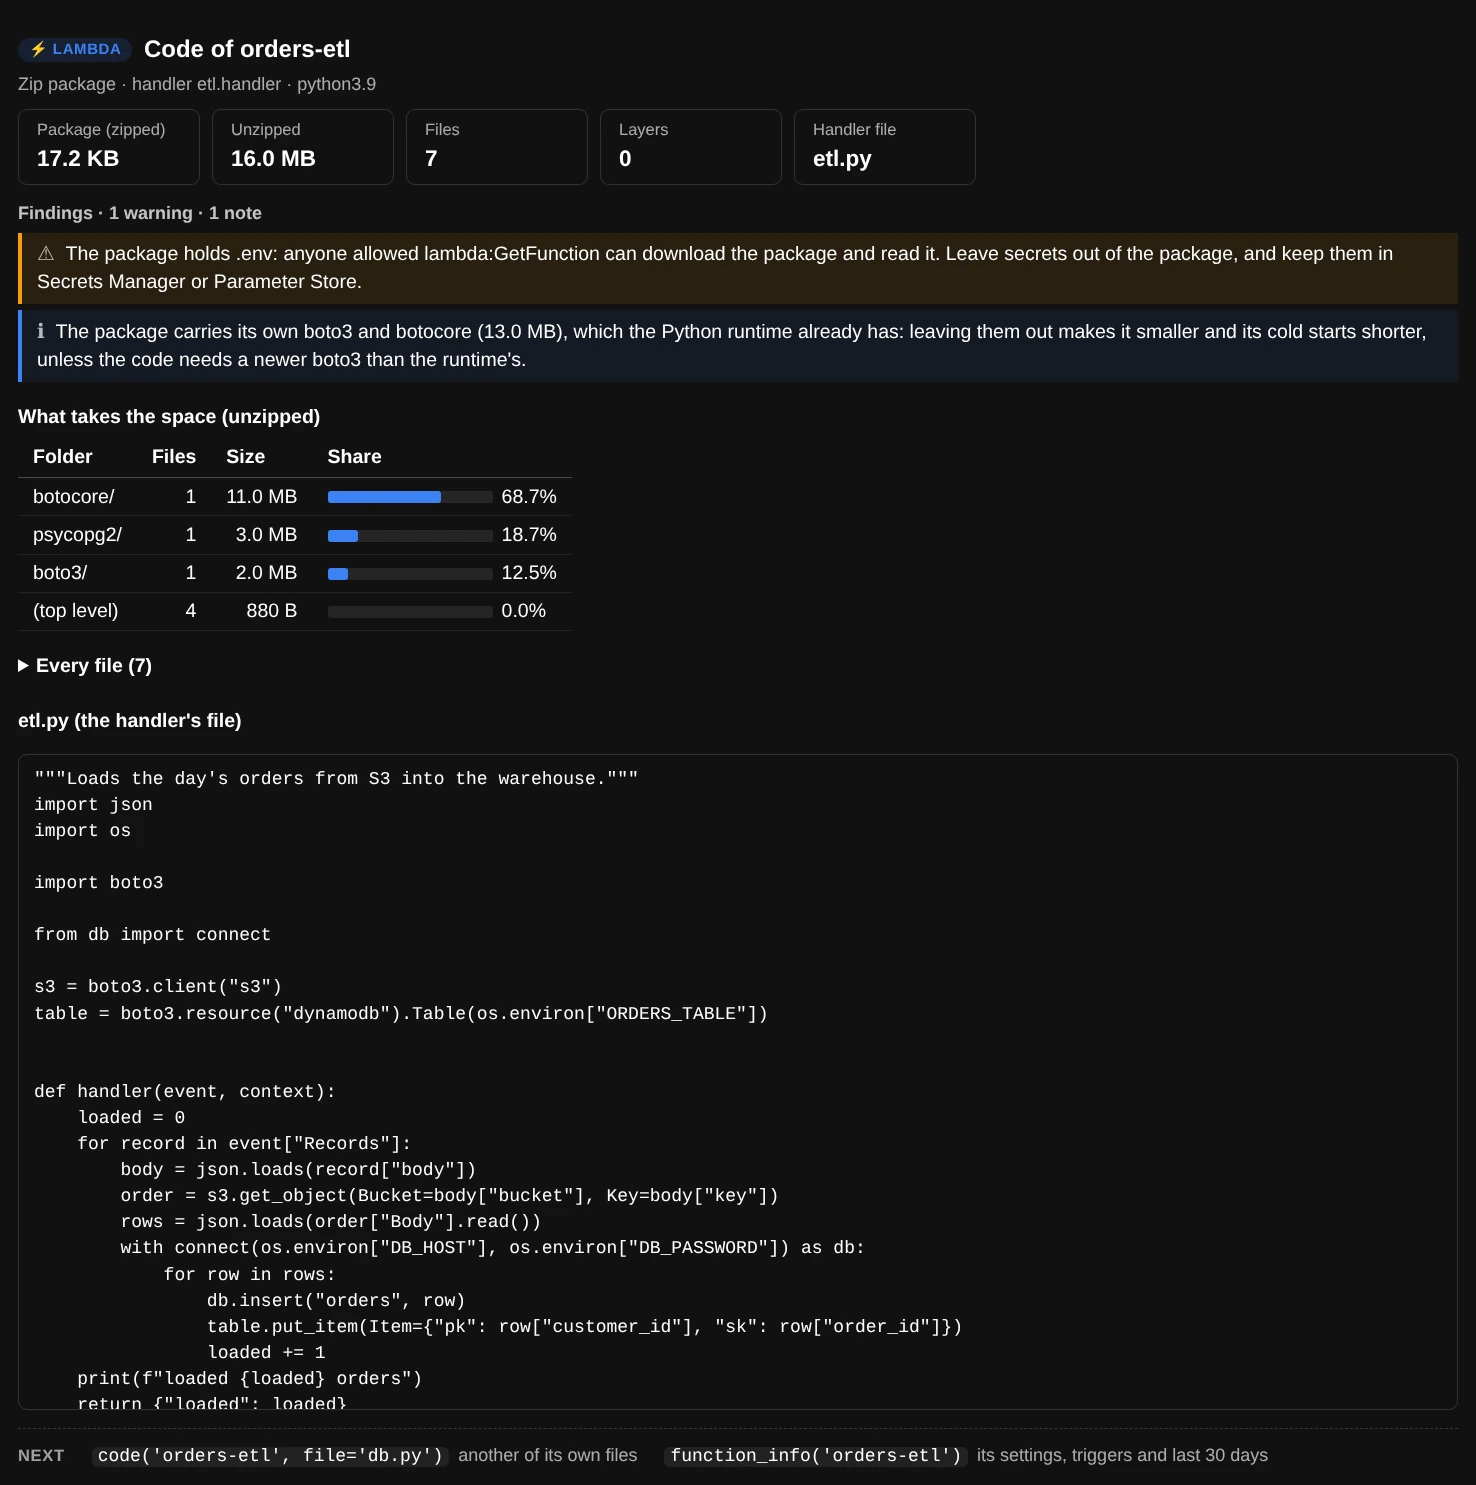
ui.code("orders-etl"): a .env file anyone allowed lambda:GetFunction can read, and 13 MB of boto3 the runtime already has.
The findings: a handler setting no file in the package matches, secrets files packed in it (.env, keys, credentials), code and layers near Lambda's 250 MB limit, boto3 bundled although the runtime has it, and caches or tests that never run. A container image isn't pulled: the report names the image instead.
Use the data in Python
Every report has a data version on ui.core (a LambdaAnalyzer) that returns dataclasses and DataFrames instead of printing.
lam = ui.core

ov = lam.overview(regions="all")                  # Overview: .functions, .metrics, .triggers, .accounts
df = ov.to_df()                                   # one row per function: settings, calls, errors, cost
detail = lam.describe("orders-etl")               # FunctionDetail: .function, .triggers, .aliases, .metrics, ...
detail.metrics.daily                              # DailyUsage per day: invocations, errors, throttles, run time

lam.errors("orders-etl", since="7d").groups       # ErrorGroup: kind, message, count, first, last, request_ids
lam.performance("orders-etl").to_df()             # one row per run: duration, billed, memory used, cold start
lam.log_events("orders-etl", since="1h", pattern='"KeyError"').to_df()
runs = lam.log_runs("orders-etl", since="24h").runs   # LogRun per call: .status, .duration, .cold, .events
lam.log_runs("orders-etl", search="ORD-1042").runs     # the runs with a line that has it, each one whole
lam.code("orders-etl").files                      # CodeFile: path, size, compressed
The analysis functions don't call AWS, so they also work on data you already have: parse_function, parse_policy, parse_event_source_mapping, runtime_status, function_monthly_cost, provisioned_monthly_cost, classify_error, group_errors, parse_report, split_runs (log lines grouped into runs), line_level, percentile, suggest_memory, handler_file, read_package (a .zip you already have), secret_like, and the findings: function_findings, account_findings, error_findings, performance_findings, package_findings.
from aws_analyzer.lambda_functions import parse_report, runtime_status, suggest_memory

runtime_status("python3.9")                       # RuntimeStatus: state 'deprecated', upgrade 'python3.14'
parse_report(report_line).max_memory              # a REPORT line from a log export
suggest_memory(max_used=180, memory=1024)         # 256
Cost
-
Calls and compute
$0.20 per million requests, and $0.0000166667 per GB-second of memory × run time on x86_64 ($0.0000133334 on arm64).
/tmpabove 512 MB is $0.0000000309 per GB-second. -
Provisioned concurrency
$0.0000041667 per GB-second for every copy kept ready, used or not ($0.0000033334 on arm64): 4 copies of a 2 GB function cost about $70 a month on arm64.
-
Logs
$0.50 per GB a function logs to CloudWatch Logs, and $0.03 per GB-month kept. Chatty functions often pay more for logs than for compute.
-
The tool itself
functions()reads 7 CloudWatch metrics per function, plus one per region ($0.01 per 1,000 metrics), and says how many. Reading logs (FilterLogEvents) and downloading code are free.
Costs are estimates at us-east-1 list prices from the AWS Price List API (LAMBDA_PRICES), before the free tier (1 million requests and 400,000 GB-seconds a month for the whole account), at the first pricing tier, and with compute that runs on provisioned concurrency billed at the on-demand rate (it's a little cheaper). Usage is what CloudWatch counted over the window, scaled to a month. API Gateway, SQS and data transfer aren't included. For another region or a discount, pass your own:
ui = LambdaView(LambdaAnalyzer(prices={"gb_second": 0.0000183, "request": 0.22}))
Permissions
Everything is read-only. Anything the notebook's role can't read shows up as a note instead of an error, so you can start with less and add what you need. This IAM policy covers every command:
{
  "Version": "2012-10-17",
  "Statement": [
    {
      "Sid": "Functions",
      "Effect": "Allow",
      "Action": [
        "lambda:ListFunctions", "lambda:GetFunction", "lambda:GetPolicy", "lambda:ListEventSourceMappings",
        "lambda:GetFunctionUrlConfig", "lambda:GetFunctionEventInvokeConfig", "lambda:ListVersionsByFunction",
        "lambda:ListAliases", "lambda:ListProvisionedConcurrencyConfigs", "lambda:GetRuntimeManagementConfig",
        "lambda:GetAccountSettings"
      ],
      "Resource": "*"
    },
    {
      "Sid": "UsageAndLogs",
      "Effect": "Allow",
      "Action": [
        "cloudwatch:GetMetricData", "logs:DescribeLogGroups", "logs:DescribeLogStreams", "logs:FilterLogEvents"
      ],
      "Resource": "*"
    },
    {
      "Sid": "EveryRegion",
      "Effect": "Allow",
      "Action": "ec2:DescribeRegions",
      "Resource": "*"
    }
  ]
}
lambda:GetFunction also returns the link code() downloads the package from, and the environment variables' values, which the reports never show. Leave it out and function_info(), errors(), logs(), performance() and code() can't start; give it to roles that may read the code. ec2:DescribeRegions is only for regions="all". The explorer window reads with the same permissions as the commands: a tab whose permission is missing says which one, and the other tabs still work.
Troubleshooting
“No Lambda functions in us-east-1”
Functions are regional, and the view reads the notebook's region unless told otherwise. functions(regions="all") looks in every region your account has turned on, and LambdaView(LambdaAnalyzer(region="eu-west-1")) makes another region the default.
“Couldn't read … (AccessDeniedException; needs lambda:…)”
The notebook's role is missing that permission. The note names it; add it from Permissions. The rest of the report still shows what could be read.
“… has no log group yet”
The function hasn't logged anything: it hasn't run, or its role can't write logs (logs:CreateLogGroup, logs:CreateLogStream, logs:PutLogEvents, in the AWSLambdaBasicExecutionRole managed policy). A function set to log to its own log group is read from there.
CloudWatch counts failed calls, but errors() finds no error lines
The code fails without logging the error (an unhandled promise rejection, a process exit), or its logging is turned down: with JSON logs, a log level above ERROR drops them. logs() shows what it did log.
“Couldn't download the code”
The package comes from S3 over HTTPS, so a notebook in a VPC without internet access needs an S3 gateway endpoint. The link Lambda gives expires after 10 minutes: run code() again.
The cost doesn't match my bill
The estimate is before the free tier, which covers small accounts entirely, and leaves out what other services charge for the same calls (API Gateway, SQS, data transfer). It scales the last 30 days to a month, so a function whose traffic changed lately is estimated from its old traffic too.
explore() shows a report instead of the window
The window needs Jupyter and ipywidgets. SageMaker has both; elsewhere, %pip install ipywidgets, then restart the kernel and reload the browser tab. In a terminal or a script, explore() shows the same as reports: functions(), or function_info() and the other reports for one function.
A run in the Logs tab says “no REPORT line yet”
Lambda writes a run's REPORT line when the run ends, so the run is still going, or it ended after the time range read. Click ↻ to read the range again, or turn on Live. A run whose START was before the range shows the lines the range holds.
The explorer window went blank after I reopened the notebook
Widgets live in the running kernel, so a saved notebook doesn't keep the window. Run the cell again.
The report lost its formatting after I reopened the notebook
JupyterLab strips the report's styles from saved output when a notebook is reopened. Run the cell again to get the formatted report back.
Command reference
Every LambdaView command. ui.help() prints the same list grouped by task, and ui.help("logs") shows one command's full description.
| Command | What it shows |
|---|---|
explore(name=None, tab=None, region=None, height=None) |
The explorer window: every function, and for the one you click its health, logs run by run, errors, run times, code and settings, by clicking |
functions(match=None, regions=None, days=30, metrics=True, details=True) |
Every function in the region (or regions, "all"): runtime and its support, memory, timeout, triggers, calls, error rate, run time, last called, estimated cost, warnings |
function_info(name, region=None, days=30) |
One function: what it runs, what triggers it and who may call it, failed asynchronous events, what it can reach, versions and aliases, its last 30 days, cost, findings |
errors(name, since="24h", region=None, limit=10000) |
Its errors grouped by cause, with what to do about each and the run to look at |
logs(name, since=None, search=None, request_id=None, n=50, region=None) |
The newest lines it logged, or one run from start to end |
performance(name, since="24h", region=None, limit=5000) |
Run times, memory used, cold starts, timeouts, the slowest runs, and the memory size that would do |
code(name, file=None, region=None, max_size="50MB") |
The files in its deployment package, findings about them, and the handler's source |
help(command=None) |
This list, grouped by task; help("name") shows one command in full |